Lanvin Group Posts Record Sales and Continued Margin Improvement in 2022, Revenues Up 37% Year-over-Year

- Revenues of €422 million for FY2022, a 37% increase over FY2021
- Margin profile improvement with Group gross profit margin increasing to 56% and both contribution profit(1) and adjusted EBITDA margins steadily improving
- All portfolio brands delivered revenue growth; Group revenues increased in all channels and geographies
- Flagship brand Lanvin had strong growth of 64% YoY and showed improvement in gross, contribution profit, and adjusted EBITDA margins
- Implementation of balanced global growth strategy resulted in 39% growth in EMEA, 36% growth in North America, and 15% growth in Greater China, despite COVID impact
- Ongoing implementation of strategic plans in 2023 to drive further revenue growth and margin improvement to achieve breakeven in FY2024
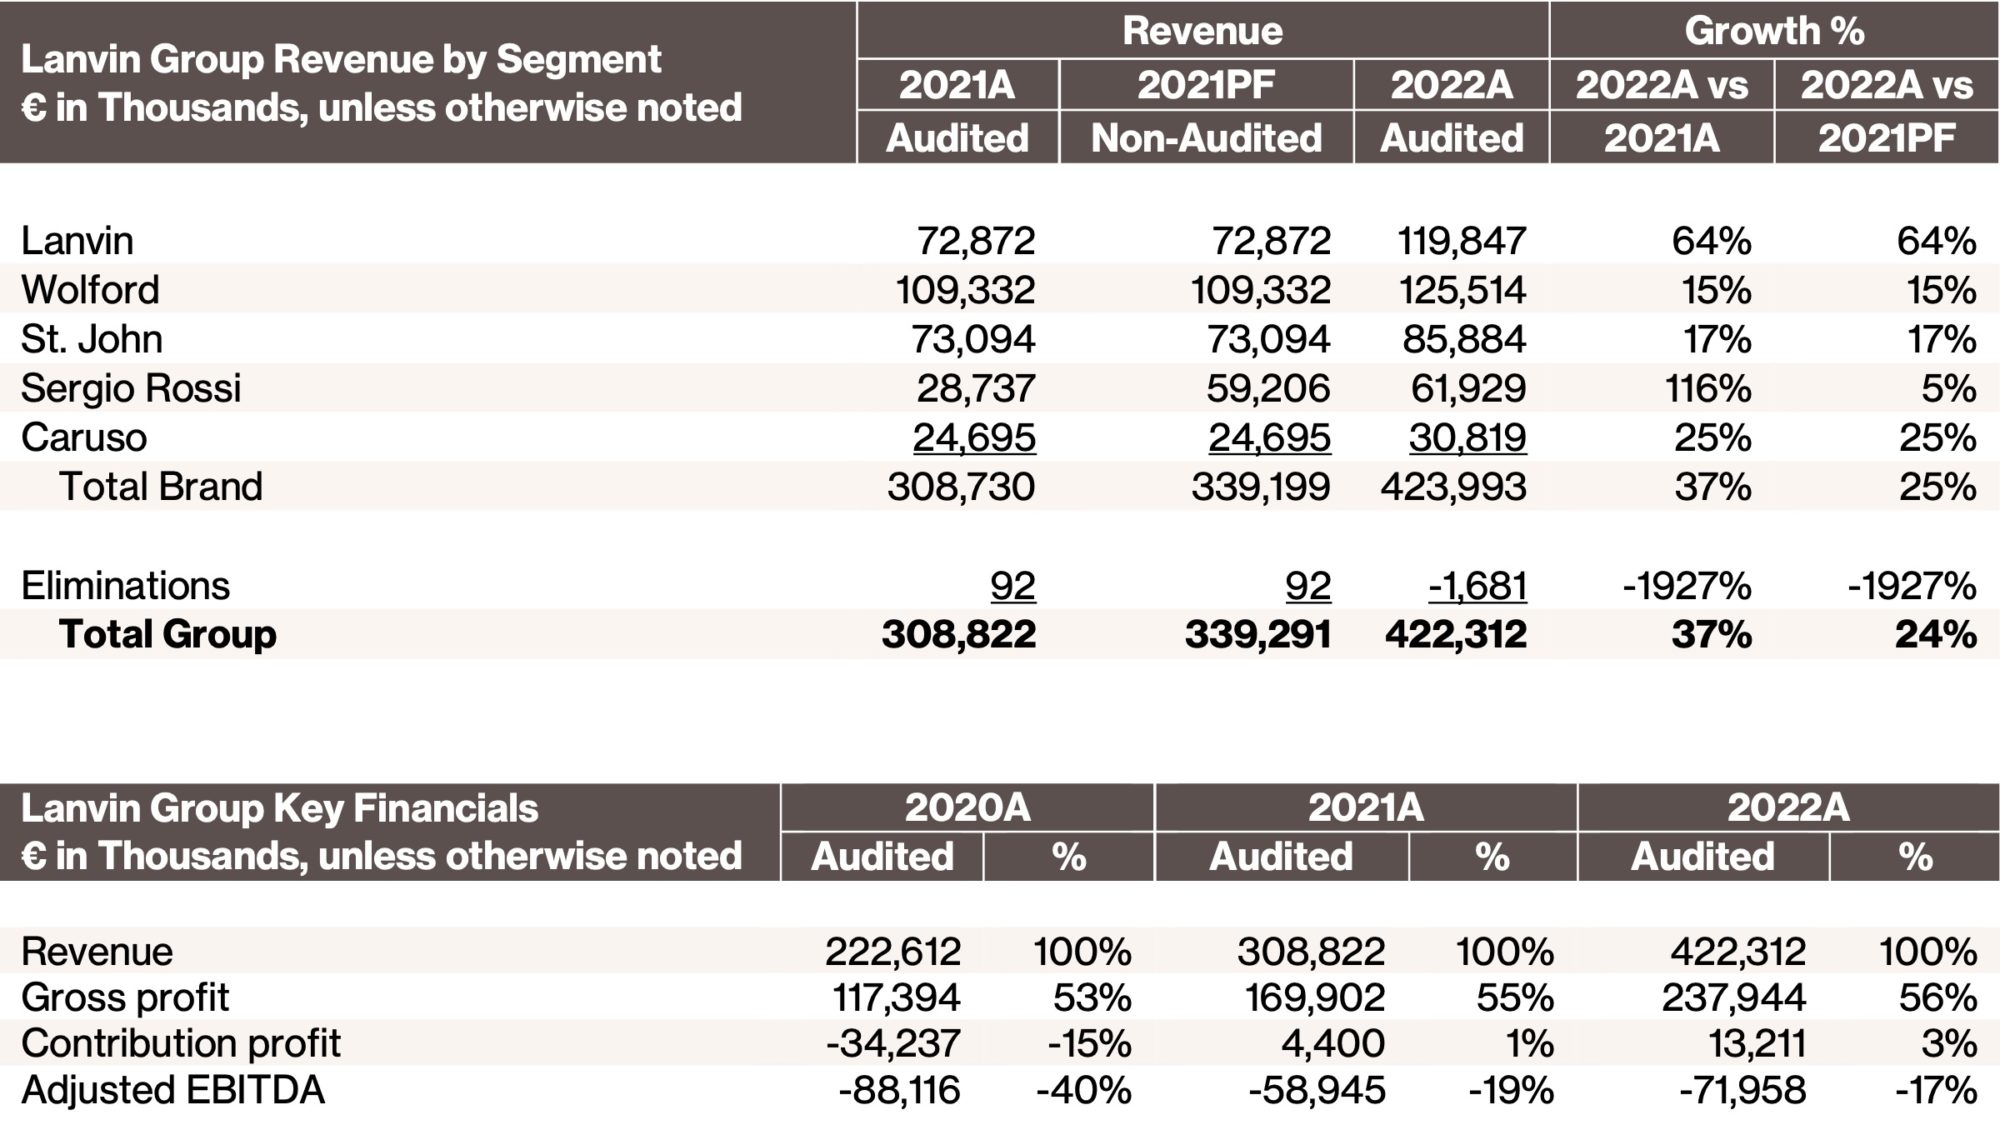
April 20, 2023 – Lanvin Group (NYSE: LANV, the “Group”), a global luxury fashion group with Lanvin, Wolford, Sergio Rossi, St. John and Caruso in its portfolio of brands, today announced its results for the full-year 2022. The Group achieved revenues of €422 million, a 37% increase year-over-year versus 2021; and gross profits of €238 million, representing a 56% gross margin and a 40% increase versus 2021.
Joann Cheng, Chairman and CEO of Lanvin Group, said: “We are pleased with the progress we made in 2022. Not only did we achieve record revenues, we also made great strides in improving our cost structure and streamlining our operations. Our progress in 2022 has laid a strong foundation for 2023, and notwithstanding current macroeconomic conditions, we remain optimistic for the current year, especially with the continued resurgence of Greater China.”
Review of the Full-Year 2022 Results
Selected Highlights
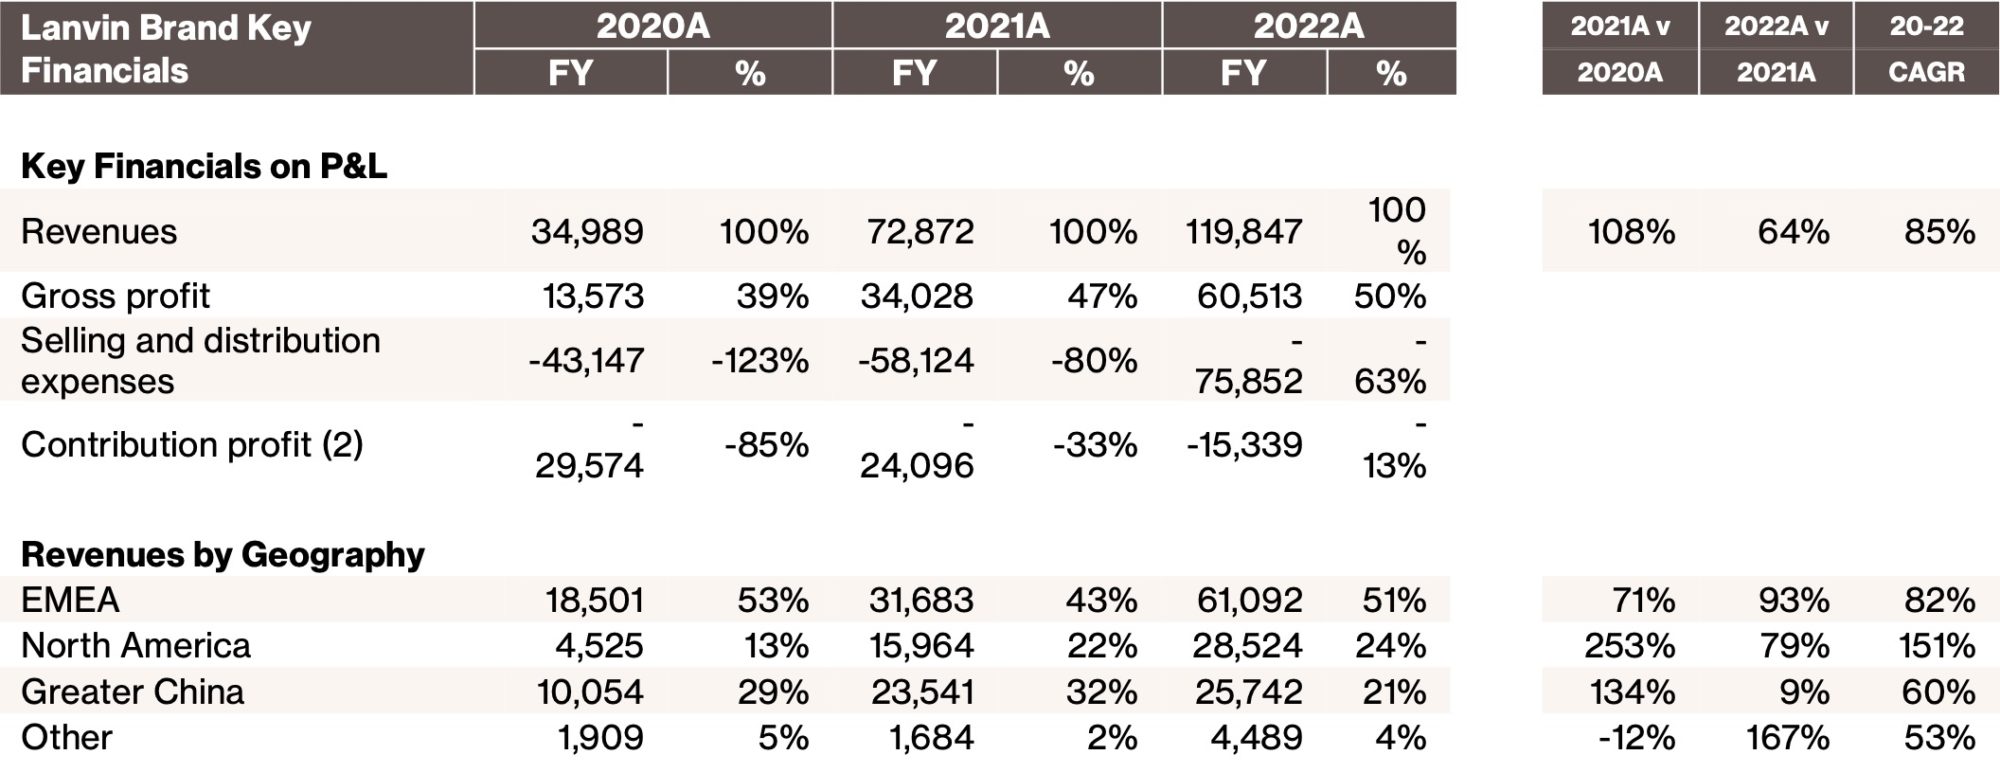
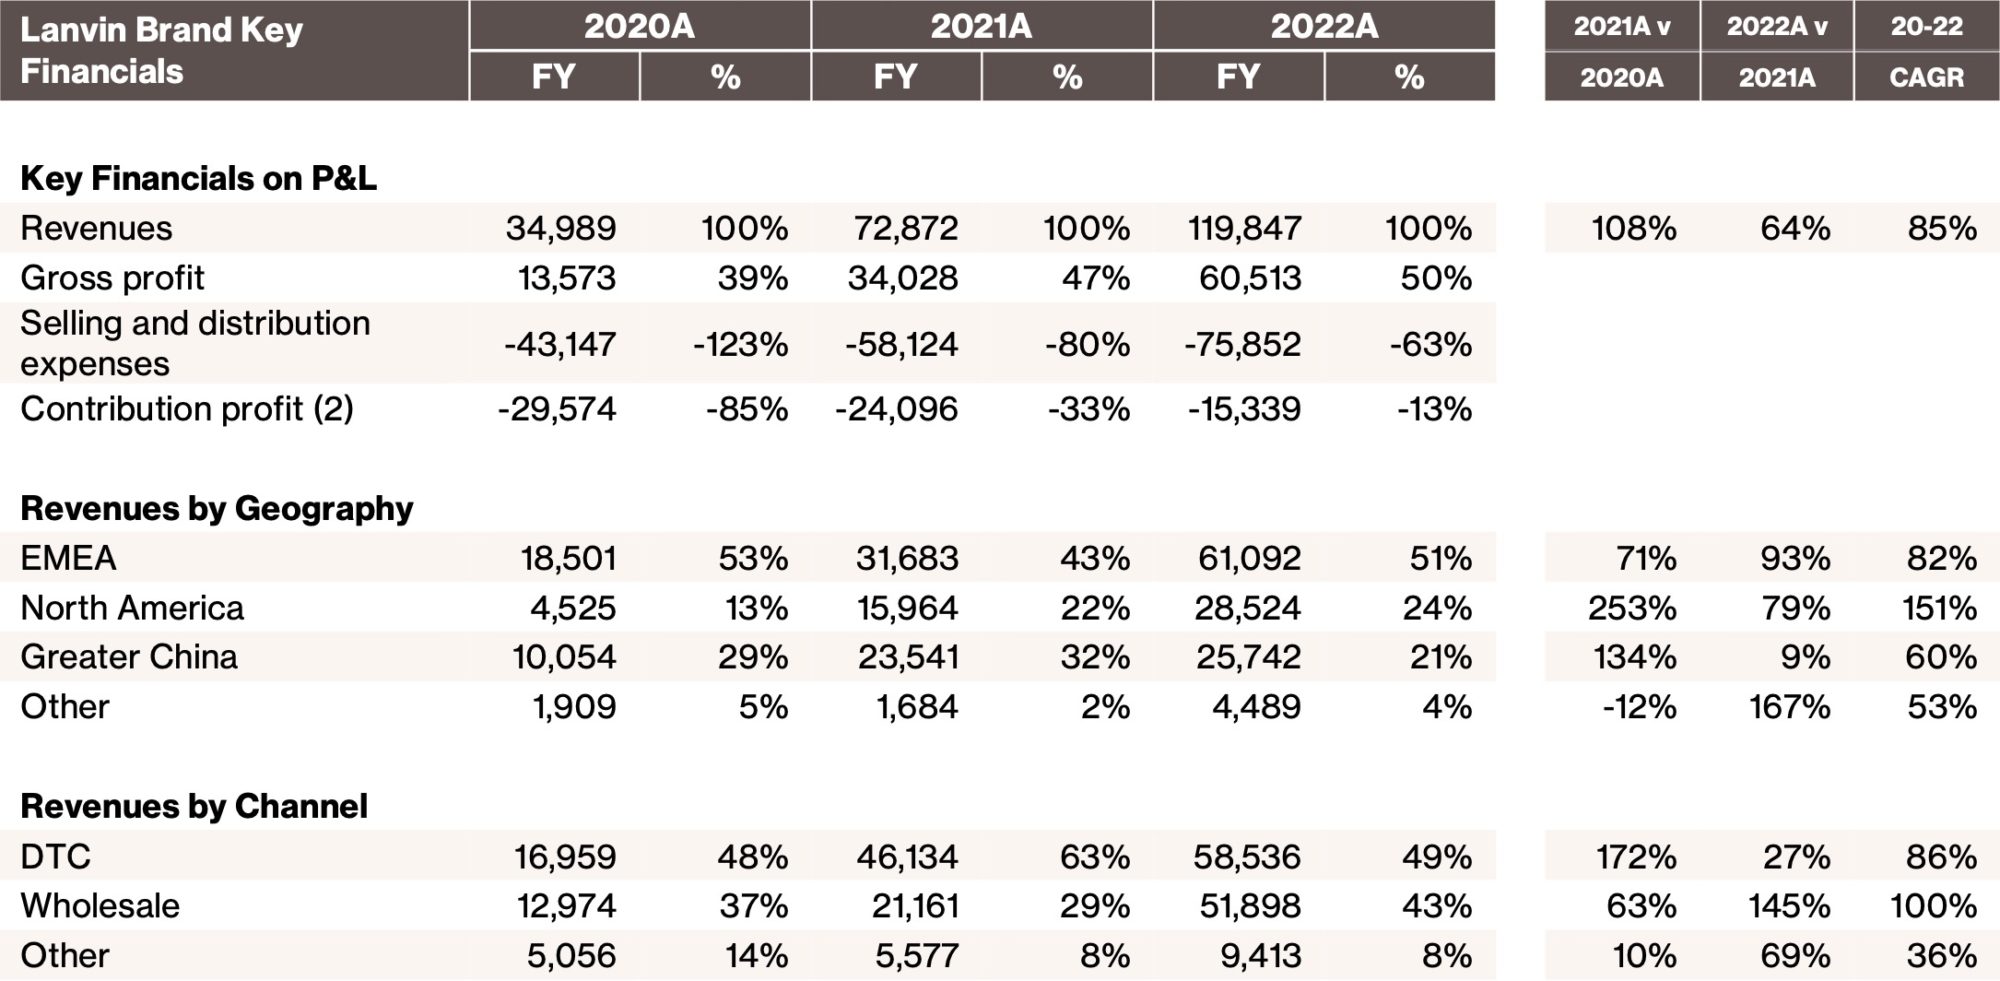
Strong growth achieved at all brands and in all channels and regions: All five brands showed year-over-year growth. Lanvin, the Group’s flagship brand, grew global revenue by 64%, with record 145% growth in its Wholesale business, and 27% growth in its DTC business. Additionally, revenues in each of the Group’s regions and channels showed strong growth, with EMEA and North America growing 39% and 36%, respectively. Of note, Greater China, hampered by the pandemic, grew by 15%.
Continued positive progress with margin profile: Margins at all levels, Gross, Contribution, and Adjusted EBITDA all saw improvement in 2022. Gross margins increased to 56% and Adjusted EBITDA as a percent of sales has increased by an impressive 23 points since 2020. Operational improvement strategies implemented in 2022 began to show results in the second half of the year, resulting in continued margin profile improvement that will have significant impact in 2023.
Refocused brand and product strategies showing results: One of the main drivers of growth in 2022 was the refocus of brand strategies and optimization of product categories and mix. New product lines and categories, collaborations, and a focus on accessories all impacted the growth and margins. Furthermore, improving digital engagement as a part of the overall strategy succeeded in attracting new and younger customers.
Digital strategies successfully initiated: Digital marketing had a strong effect on the 2022 results with the brands increasingly attracting new and younger demographics. In the second half of 2022, the Group established a shared digital platform with a North American partner to distribute the Group’s brand online. Sergio Rossi and Lanvin have already successfully transitioned their North American eCommerce to this platform, which is expected to bring further growth to the brands in the coming years.
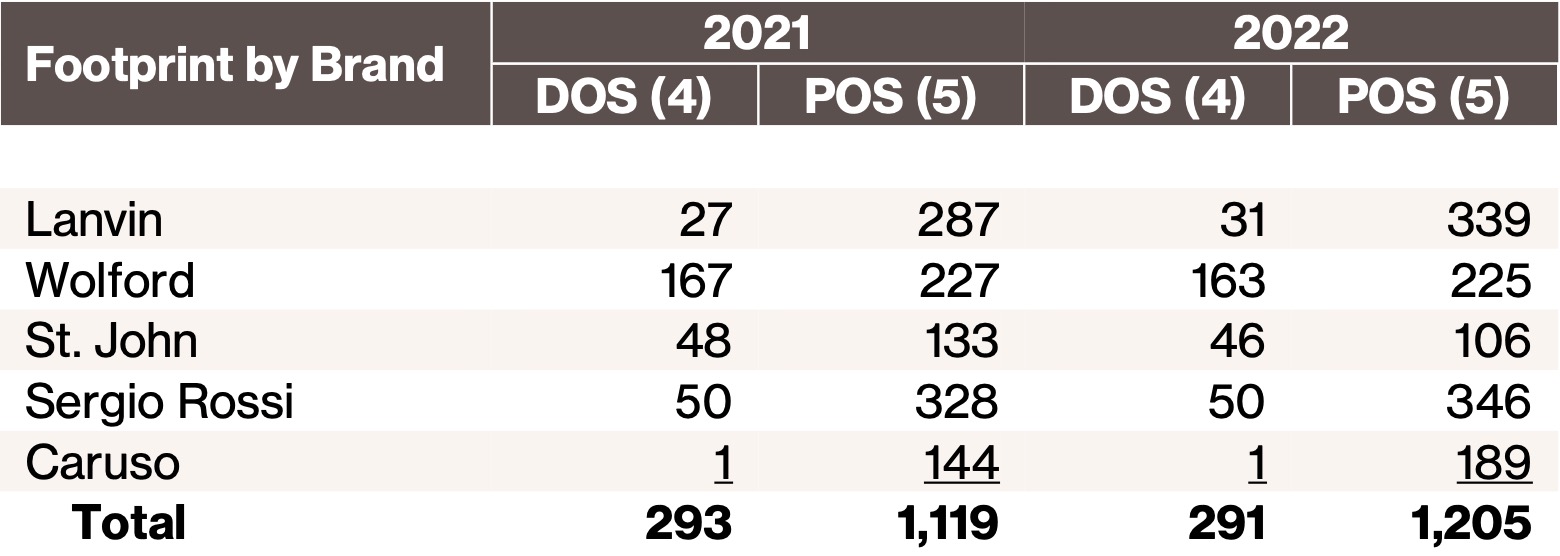
Significant progress optimizing store network: The Group successfully launched 47 new retail doors, systemwide. Improved store strategies implemented in 2022 have improved the unit economics, with the Group’s whole network of retail doors achieving double-digit growth on a like-for-like basis. Additionally, the Group with the brand-level management teams worked aggressively to cull the network, including closing 49 underperforming stores throughout its network. These initiatives provide a strong foundation for physical footprint growth in 2023 and beyond.
Review of FY2022 Financials
Revenues
For FY2022, the Group generated revenues of €422 million, a 37% increase year-over-year. All brands showed strong growth with Lanvin leading the way with a 64% increase year-over-year. The DTC and Wholesale channels grew by 32% and 41%, respectively. The Group maintained its strong growth trend with a compound annual growth rate of 38% since 2020. Full details of the Group’s revenues can be found in our Annual Report on Form 20-F for the year ended December 31, 2022
Gross Profit
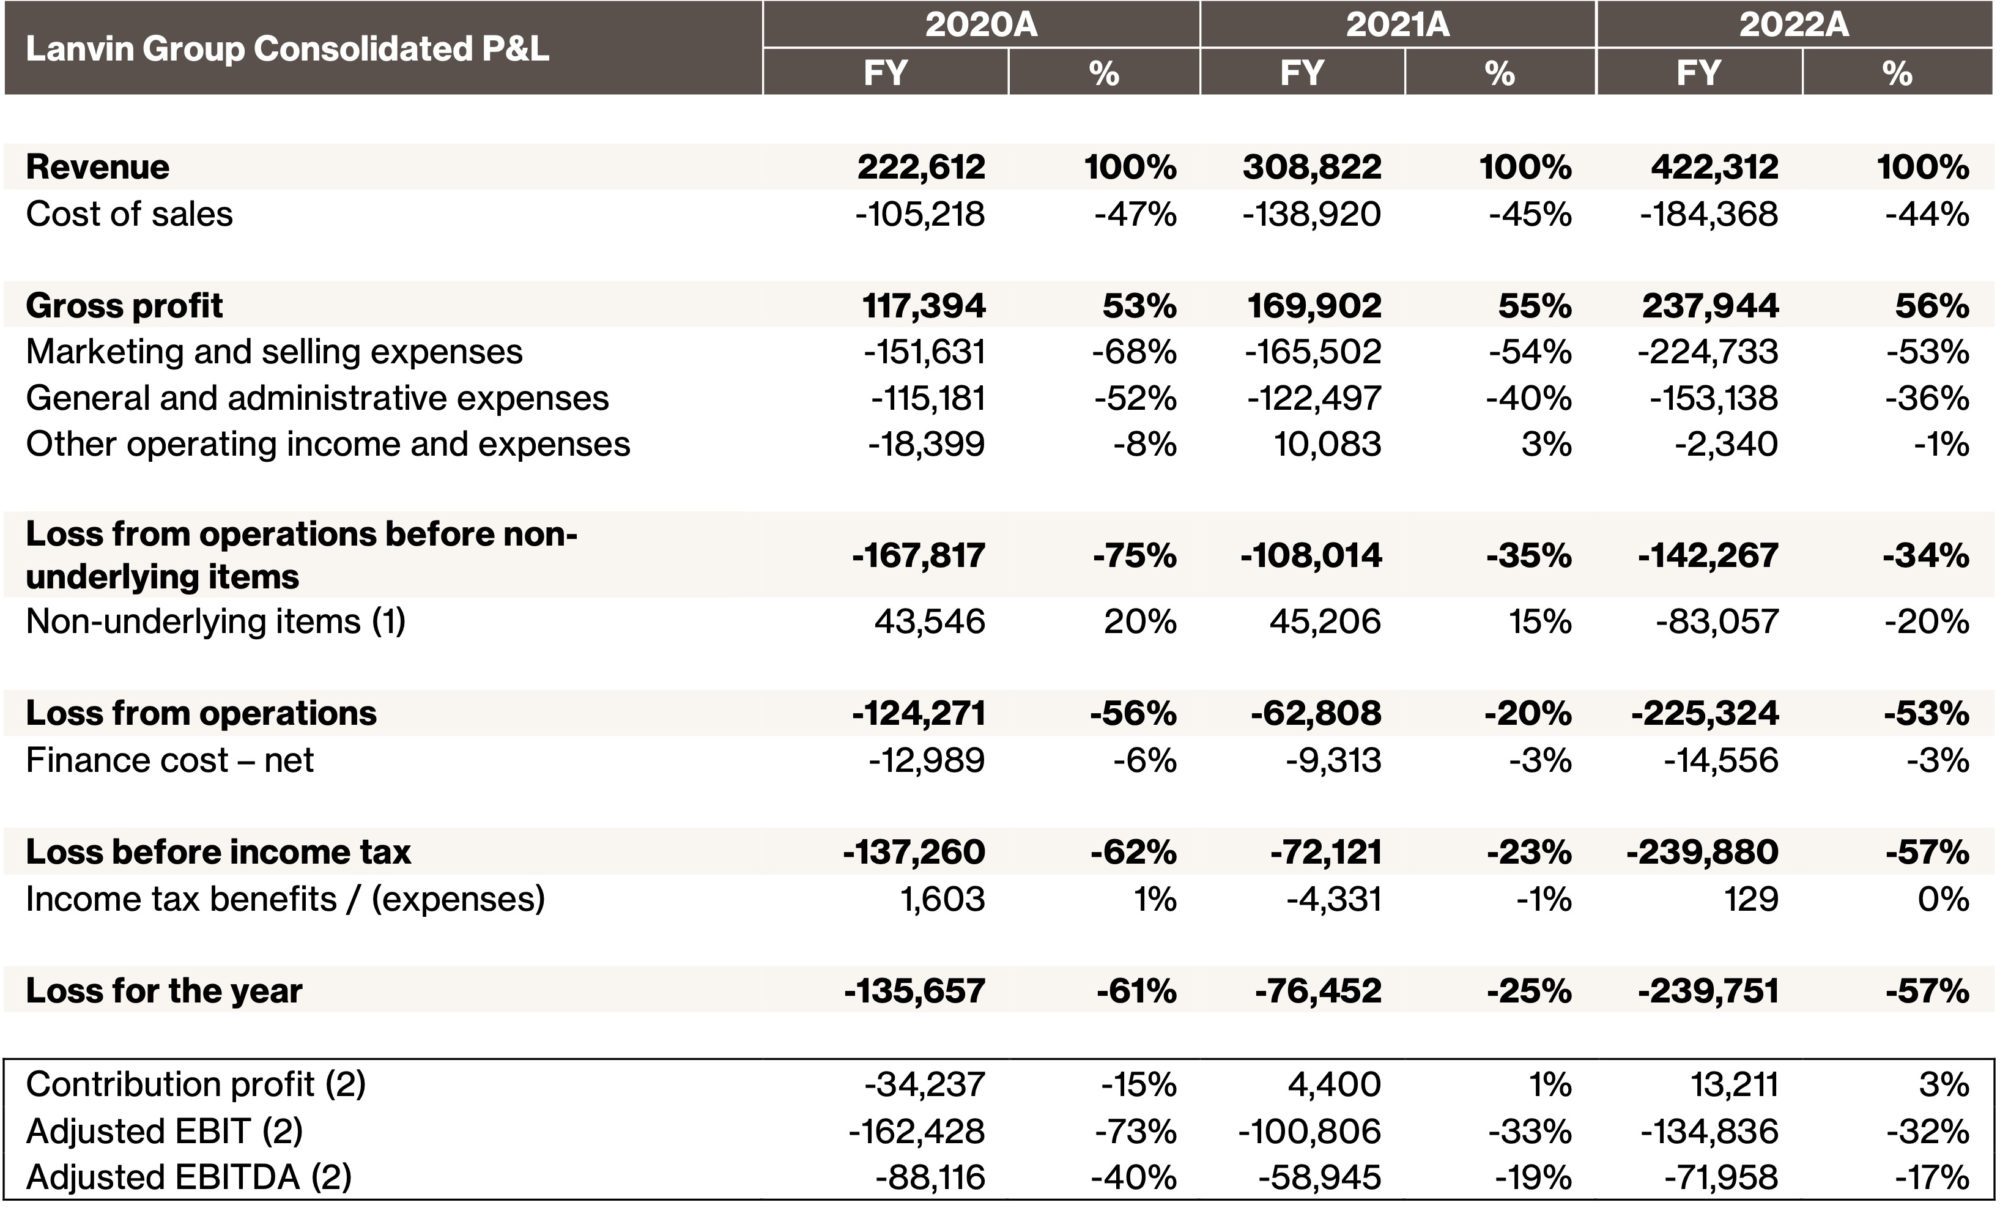
Gross profit increased to €238 million, representing a 56% margin versus €170 million in 2021 at a margin of 55%, a year-over-year growth of 40%. Gross profit has more than doubled since 2020, when the Group had €117 million at a margin of 53%. The Group has continued to improve its margin profile through its brand-level operational initiatives.
Contribution Profit(1)
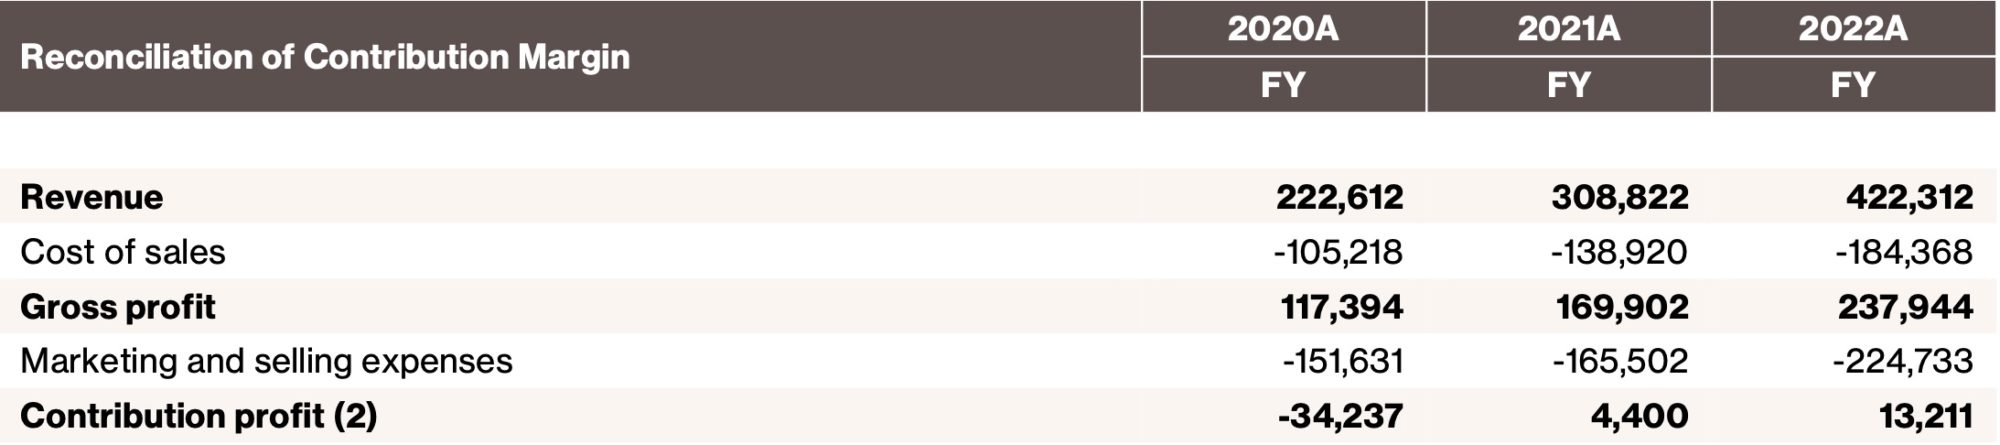
The Group uses a measure, internally, called contribution profit, defined as gross profit less selling & marketing expenses to gauge the variable profitability performance and analyze the improvements at our brands. Contribution profit for the year was €13 million, an improvement of €9 million from 2021, the first year of positive contribution profits, and a tremendous increase from 2020 when it measured negative €34 million.
Adjusted EBITDA
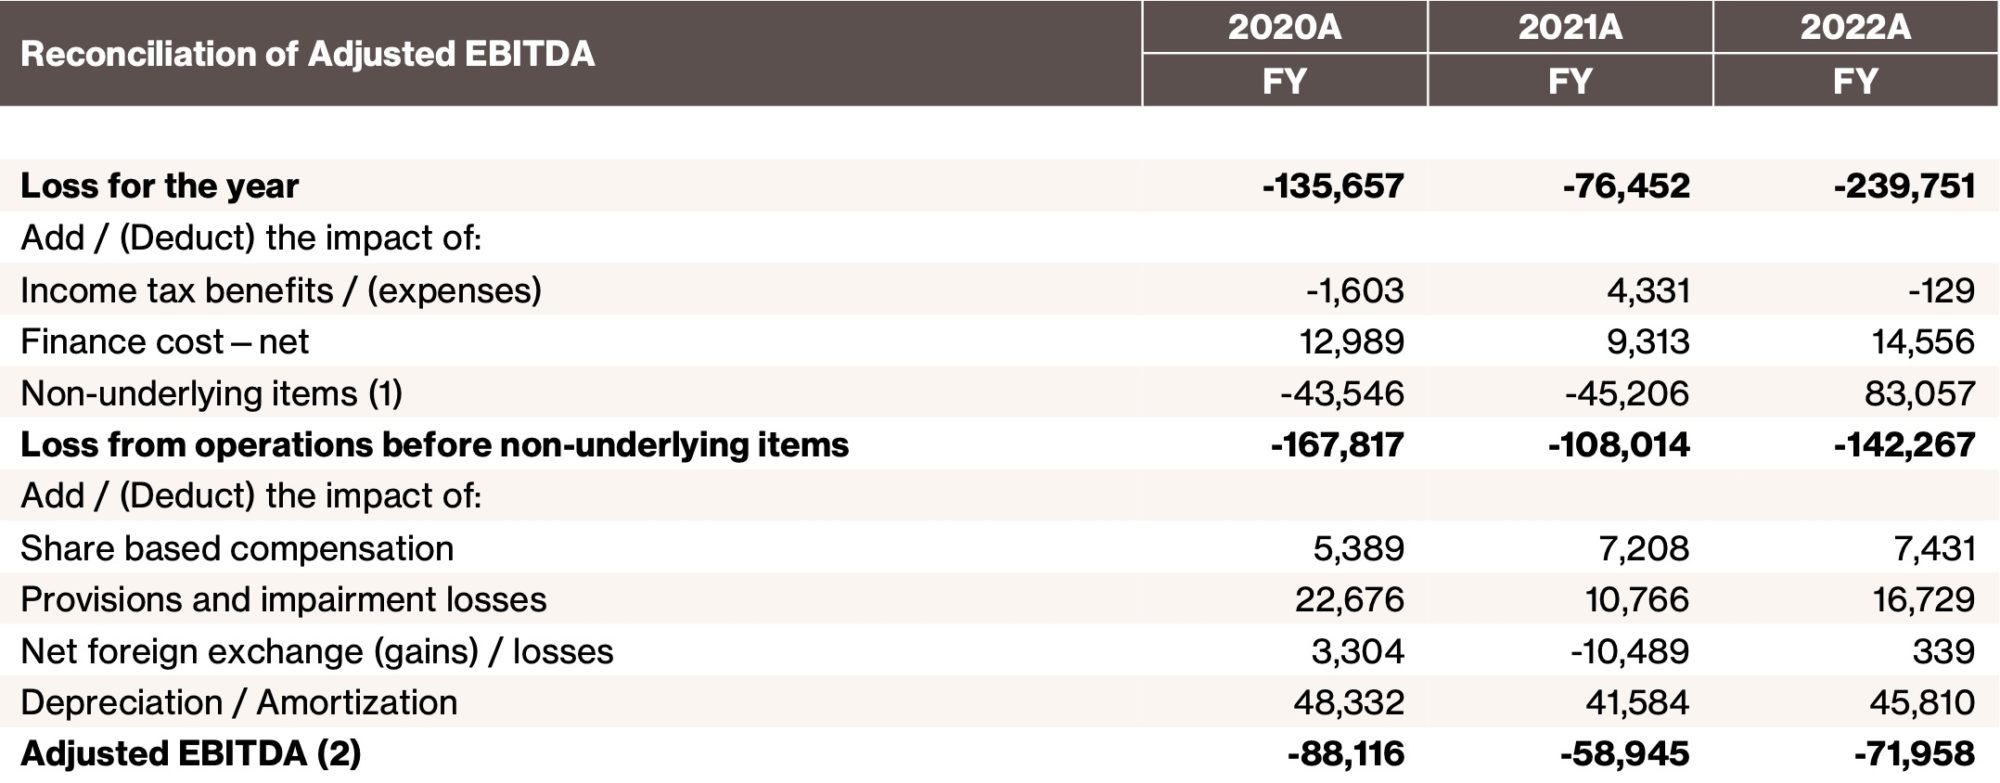
Adjusted EBITDA remained at loss for 2022, but as a percentage of sales, continued to improve going from (40%) in 2020 to (19%) in 2021 and (17%) in 2022.
Profit Results by Segment
Lanvin: Gross profits increased to €61 million, at a margin of 50%, from €34 million, at a margin of 47%, in 2021. Gross profit improved from higher sell-through rates in all product categories as well as increasing economies of scale. Contribution profits continued to improve going from a contribution loss of €24 million in 2021 to a contribution loss of €15 million in 2022 with the percentage of sales improving 20 points year-over-year from negative 33% to negative 13%.
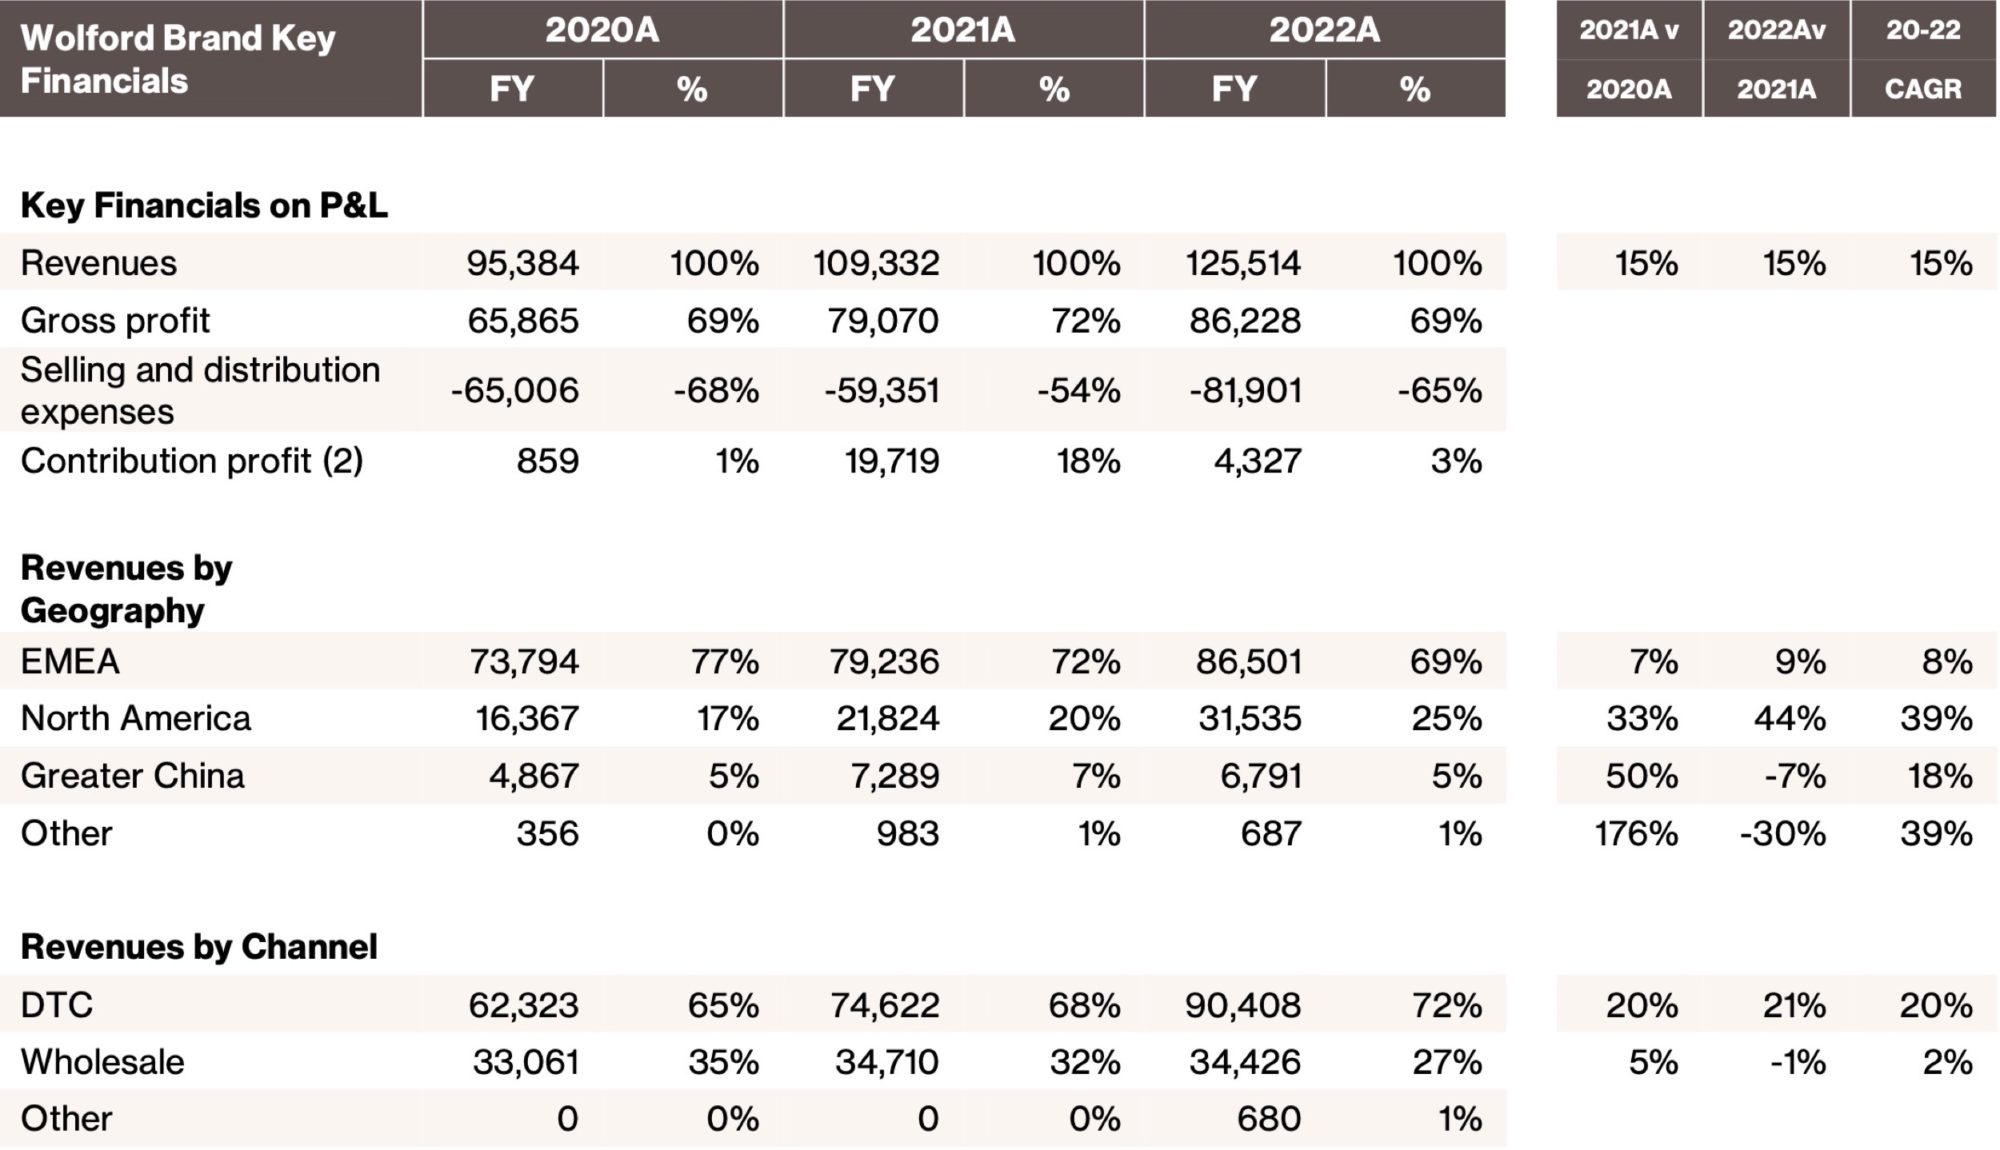
Wolford: Gross profits increased to €86 million from €79 million, in 2021. Margins declined slightly due to materials inflation as well as production personnel costs increasing from furloughed employees returning to work at higher wages. Contribution profits fell to €4 million from €20 million mainly driven by non-recurring expenses. These include legacy operational improvement consulting fees charged in the first half of the year, prior to the new management team taking over in the second-half of 2022, as well as a cyberattack in December 2022 at a third-party logistics provider that disrupted deliveries during the peak holiday season.
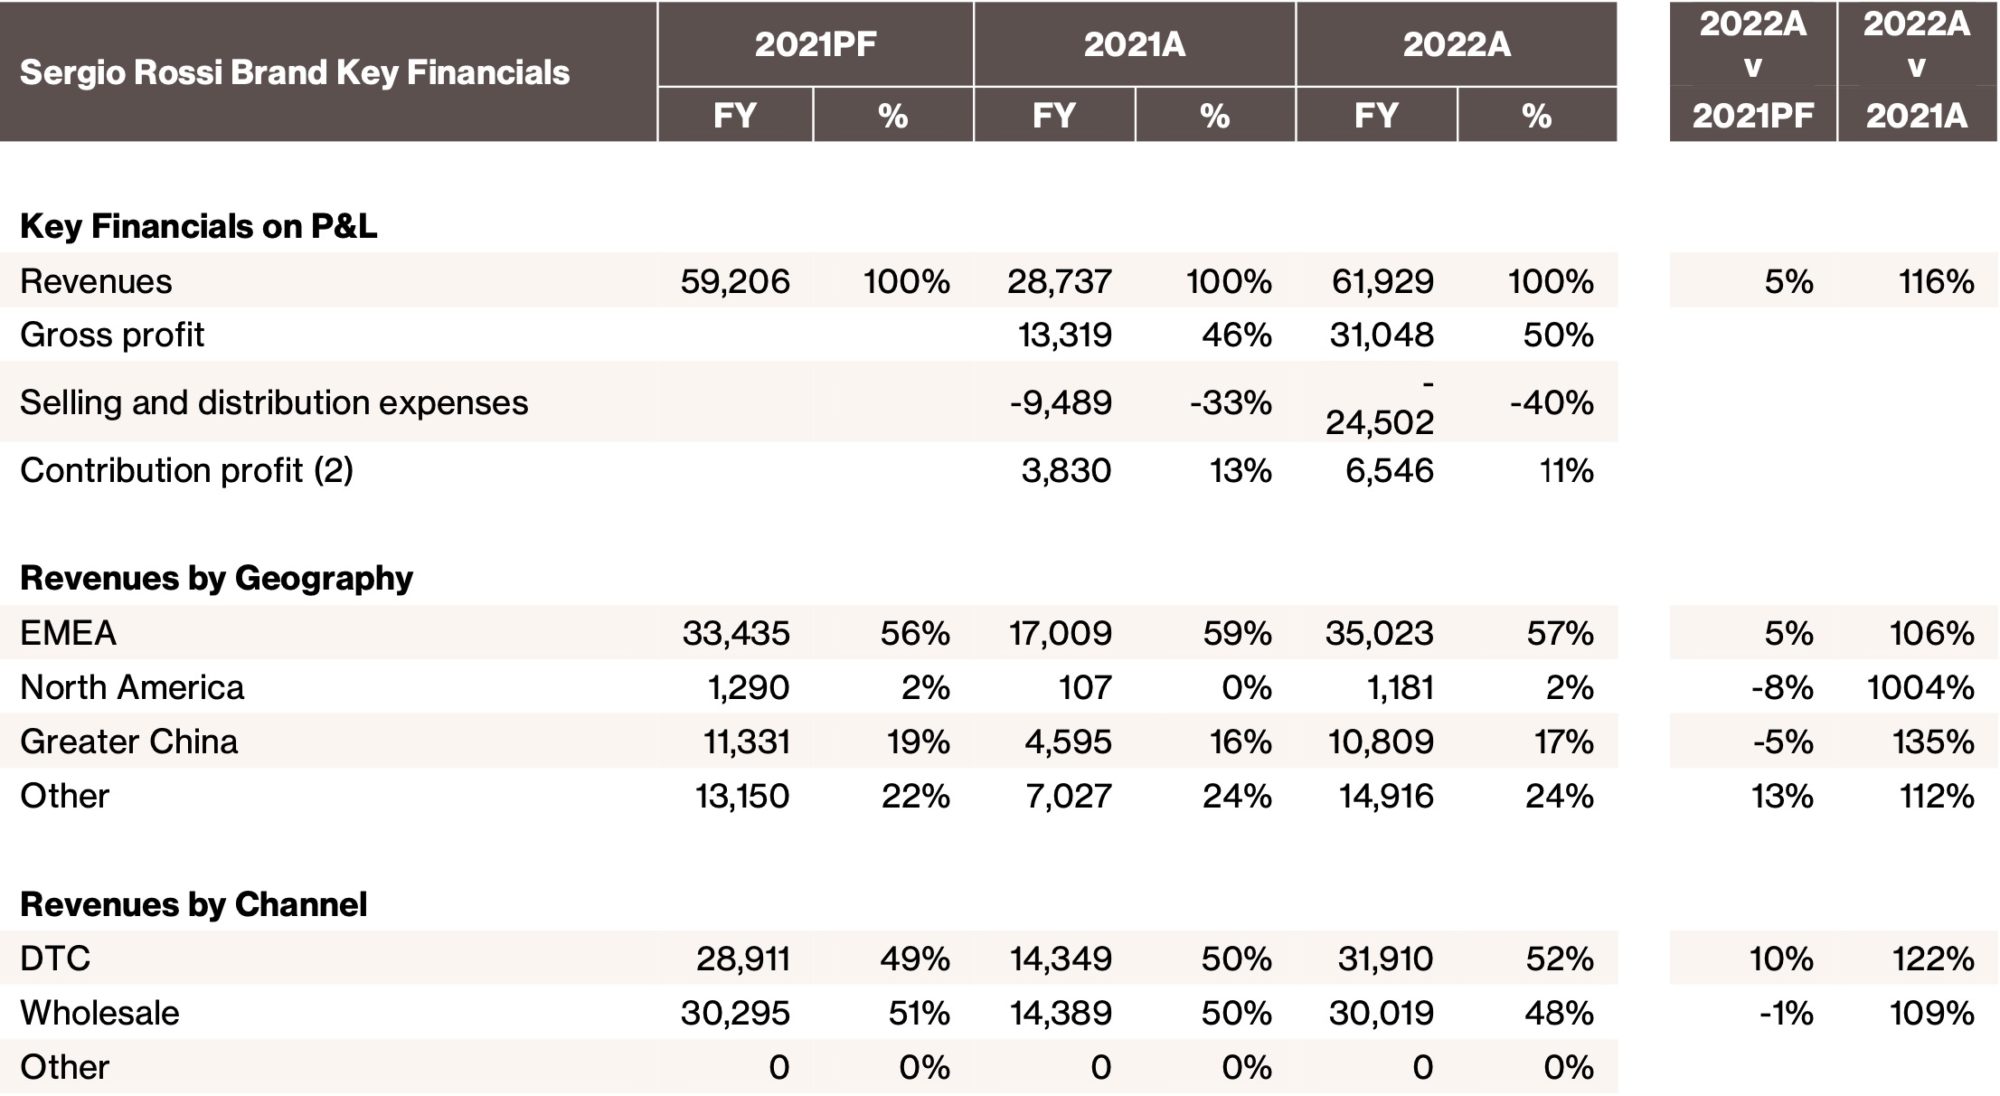
Sergio Rossi: Sergio Rossi was acquired in July 2021. Since then, gross margins increased from 46% to 50% in 2022. Gross margins improved from an increased proportion of higher-margin DTC sales. Contribution margins declined slightly in 2022 from 13% to 11% due to higher investments in personnel, marketing and rental expenses.
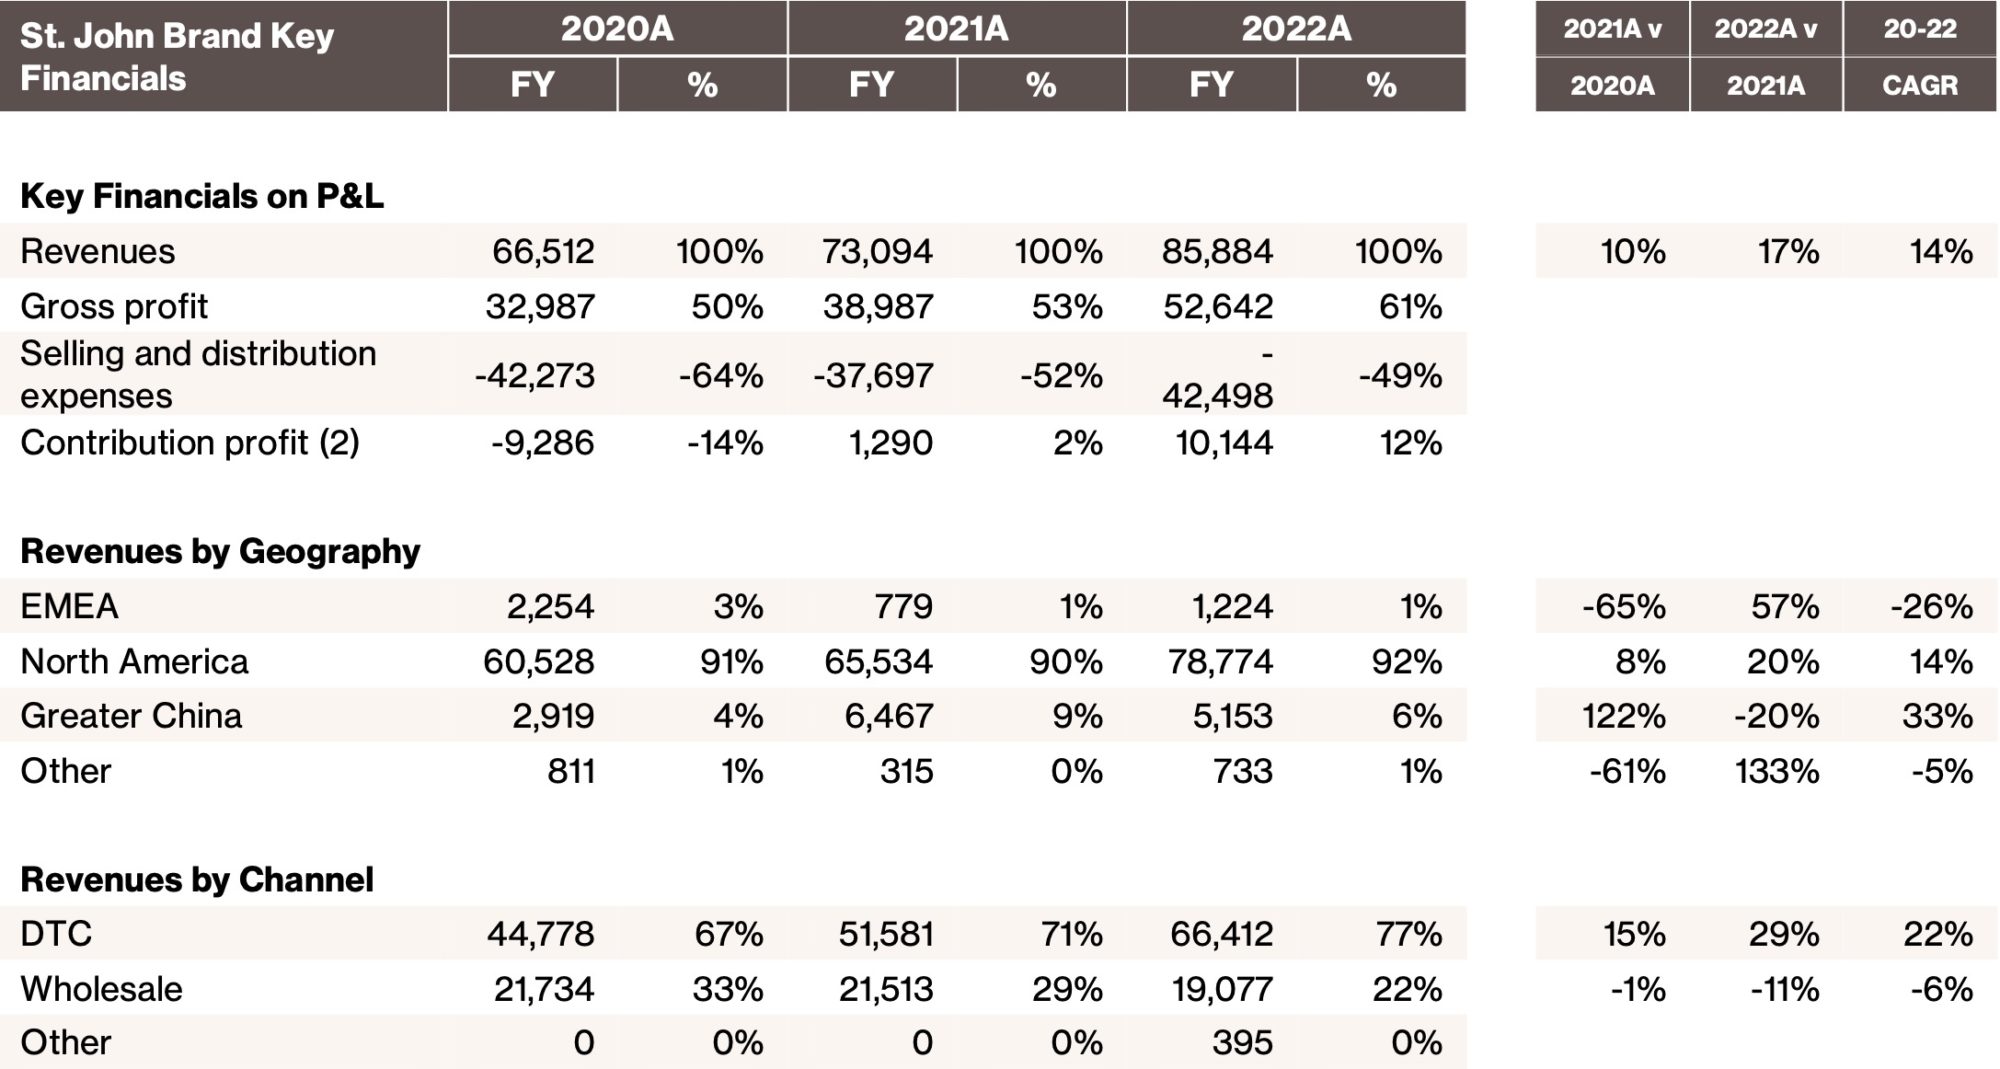
St. John: St. John’s margin profile improved dramatically with gross profit growing from €39 million to €53 million in 2022; with margins increasing from 53% to 61%. Contribution profits also increased from €1 million to €10 million; margins increased from 2% to 12%. St. John represents the culmination of the Group’s brand-level strategic planning with many of its initiatives nearing completion and bearing results.
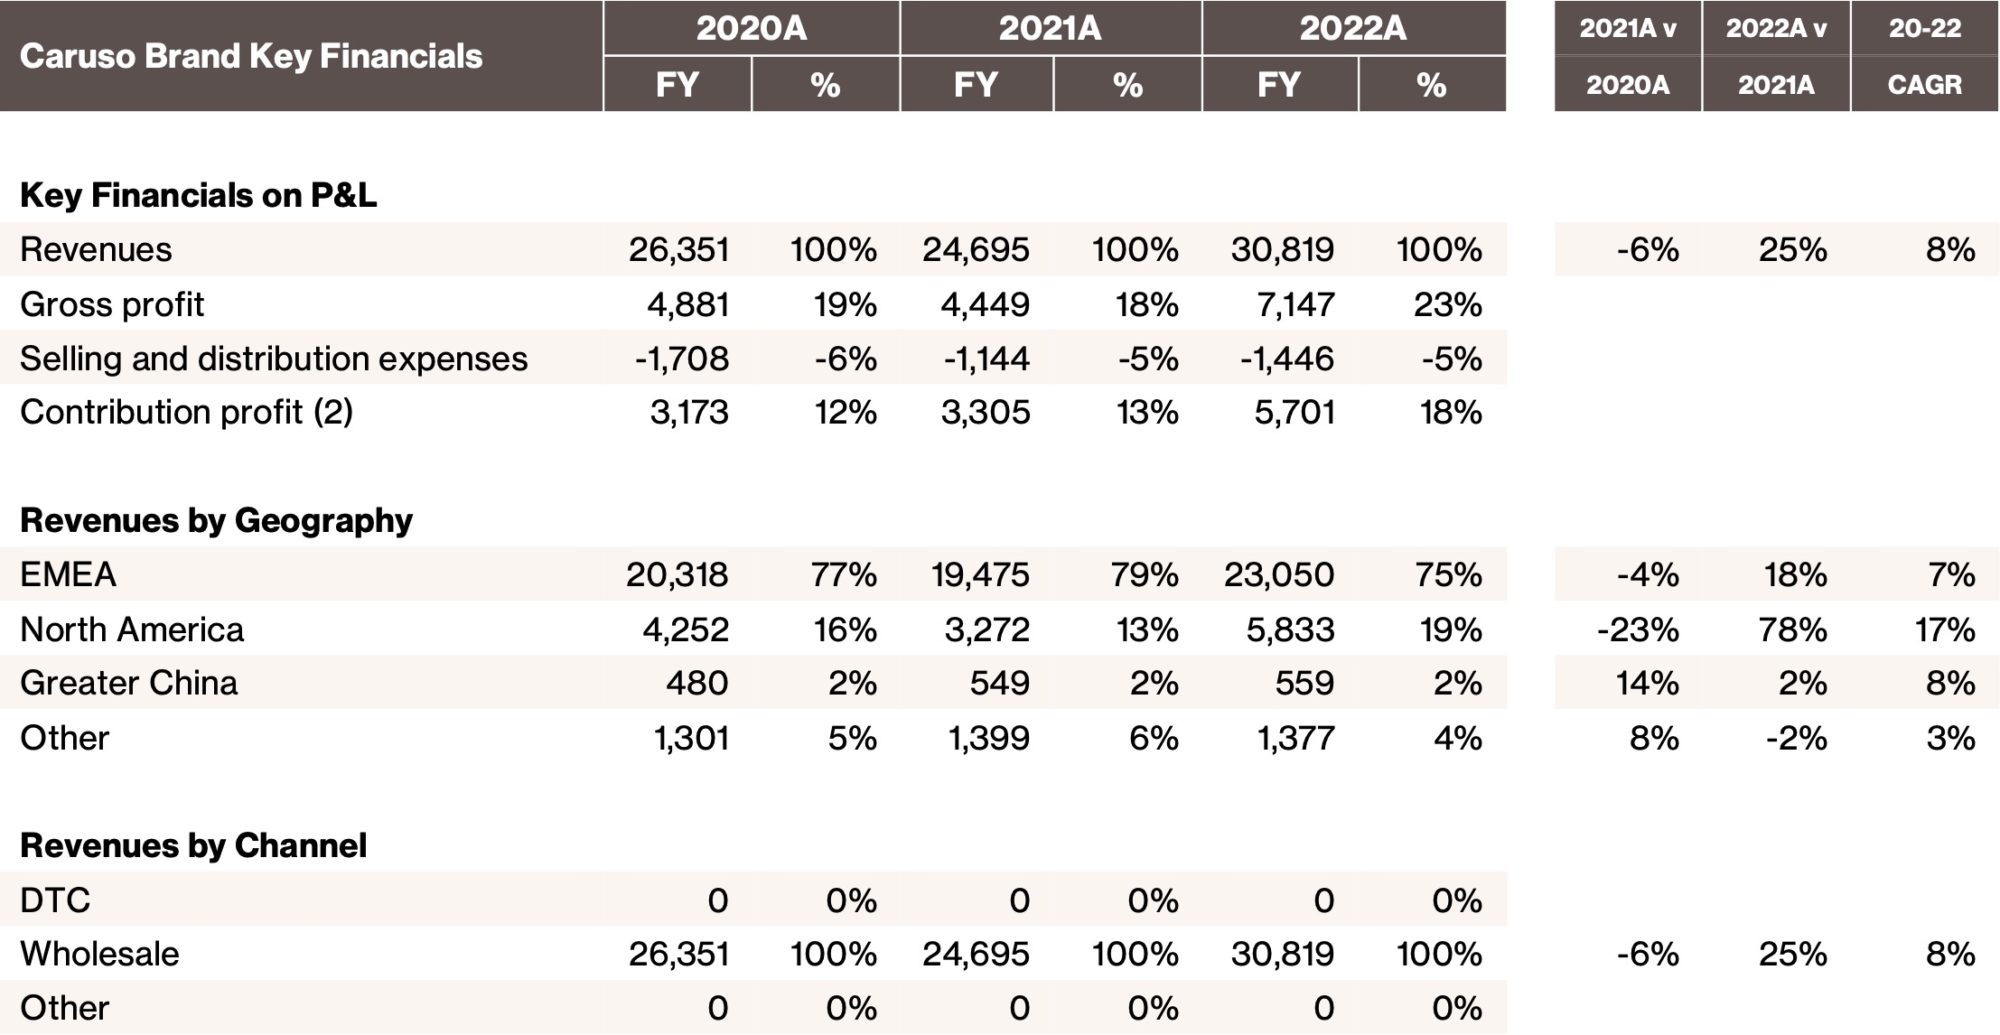
Caruso: Caruso continued its strong, steady performance with its gross profits increasing from €4 million to €7 million in 2022, and margins increasing from 18% to 23%. Contribution profits also increased from €3 million to €6 million, and contribution margins increased markedly from 13% to 18%. Caruso leveraged higher sales from new accounts and deeper penetration with current customers to increase its profitability through economies of scale coupled with better management of factory labor costs as well as selling and marketing expenses.
2023 Outlook
Notwithstanding the continuing macroeconomic issues, the Group expects to maintain its 2022 momentum into 2023 and achieve solid margin improvement as the year progresses.
Many of the “nuts and bolts” initiatives started in 2022 will reach completion in 2023 resulting in continued margin improvement. Additionally, a significant portion of the store optimization has taken place and while the Group will continue to enhance its retail network in 2023, we believe the foundation is in placed to opportunistically grow its footprint. The Group remains on track for breakeven profitability in FY2024.
The Group is built upon a collaborative eco-system and continues to work with their strategic partners to build the platform. As such, the Group continues to seek and review potential new investment and acquisition opportunities to further enhance its brands and platform.
———————————-
Note: All % changes are calculated on an actual currency exchange rate basis.
Note: Lanvin Group acquired a majority stake in Sergio Rossi in July 2021 and Sergio Rossi was consolidated into Lanvin Group’s consolidated revenue starting from the acquisition date.
Note: This communication includes certain non-IFRS financial measures such as contribution profit, contribution margin, adjusted earnings before interest and taxes (“Adjusted EBIT”), and adjusted earnings before interest, taxes, depreciation and amortization (“Adjusted EBITDA”). Please see Non-IFRS Financial Measures and Definition.
(1) Contribution profit defined as gross profit less Selling and Marketing Expenses
***
Annual Report on Form 20-F
Our annual report on Form 20-F, including the consolidated financial statements for the fiscal year ended December 31, 2022, can be downloaded from the Company’s investor relations website (ir.lanvin-group.com) under the section Financials / SEC Filings, or from the SEC’s website (www.sec.gov).
***
Conference Call
As previously announced, today at 8:00AM EST/8:00PM CST/2:00PM CET, Lanvin Group will host a conference call to discuss its results for the full-year 2022 and provide an outlook for 2023. Management will refer to a slide presentation during the call, which will be made available on the day of the call. To view the presentation, please visit the “Events” tab of the Group’s investor relations website at https://ir.lanvin-group.com. To participant in the conference call, please dial into the following numbers:
United States Toll Free: 1-888-346-8982
International: 1-412-902-4272
Mainland China Toll Free: 4001-201203
Hong Kong Toll Free: 800-905945
Hong Kong-Local Toll: 852-301-84992
Singapore Toll Free: 800-120-6157
A replay of the conference call will be accessible approximately one hour after the live call until April 27, 2023, by dialing the following numbers:
US Toll Free: 1-877-344-7529
International Toll: 1-412-317-0088
Canada Toll Free: 855-669-9658
Replay Access Code: 3267257
A recorded webcast of the conference call and a slide presentation will also be available on the Group’s investor relations website at https://ir.lanvin-group.com.
***
Next Scheduled Announcement
The next scheduled announcement will be the H1 2023 earnings results release in August 2023. To receive email alerts of the timing of future financial news releases, as well as future announcements, please register at https://ir.lanvin-group.com.
***
About Lanvin Group
Lanvin Group is a leading global luxury fashion group headquartered in Shanghai, China, managing iconic brands worldwide including Lanvin, Wolford, Sergio Rossi, St. John Knits, and Caruso. Harnessing the power of its unique strategic alliance of industry-leading partners in the luxury fashion sector, Lanvin Group strives to expand the global footprint of its portfolio brands and achieve sustainable growth through strategic investment and extensive operational know-how, combined with an intimate understanding and unparalleled access to the fastest-growing luxury fashion markets in the world. Lanvin Group is listed on the New York Stock Exchange under the ticker symbol ‘LANV’. For more information about Lanvin Group, please visit www.lanvin-group.com, and to view our investor presentation, please visit https://ir.lanvin-group.com.
***
Forward-Looking Statements
This communication, including the section “2023 Outlook”, contains “forward-looking statements” within the meaning of the “safe harbor” provisions of the Private Securities Litigation Reform Act of 1995. Forward-looking statements generally are accompanied by words such as “believe,” “may,” “will,” “estimate,” “continue,” “anticipate,” “intend,” “expect,” “should,” “would,” “plan,” “predict,” “potential,” “seem,” “seek,” “future,” “outlook,” “project” and similar expressions that predict or indicate future events or trends or that are not statements of historical matters. These forward-looking statements include, but are not limited to, statements regarding estimates and forecasts of other financial and performance metrics and projections of market opportunity. These statements are based on various assumptions, whether or not identified in this communication, and on the current expectations of the respective management of Lanvin Group and are not predictions of actual performance. These forward-looking statements are provided for illustrative purposes only and must not be relied on by an investor as, a guarantee, an assurance, a prediction or a definitive statement of fact or probability. Actual events and circumstances are difficult or impossible to predict and will differ from assumptions. Many actual events and circumstances are beyond the control of Lanvin Group. Potential risks and uncertainties that could cause the actual results to differ materially from those expressed or implied by forward-looking statements include, but are not limited to, changes adversely affecting the business in which Lanvin Group is engaged; Lanvin Group’s projected financial information, anticipated growth rate, profitability and market opportunity may not be an indication of its actual results or future results; management of growth; the impact of COVID-19 or similar public health crises on Lanvin Group’s business; Lanvin Group’s ability to safeguard the value, recognition and reputation of its brands and to identify and respond to new and changing customer preferences; the ability and desire of consumers to shop; Lanvin Group’s ability to successfully implement its business strategies and plans; Lanvin Group’s ability to effectively manage its advertising and marketing expenses and achieve desired impact; its ability to accurately forecast consumer demand; high levels of competition in the personal luxury products market; disruptions to Lanvin Group’s distribution facilities or its distribution partners; Lanvin Group’s ability to negotiate, maintain or renew its license agreements; Lanvin Group’s ability to protect its intellectual property rights; Lanvin Group’s ability to attract and retain qualified employees and preserve craftmanship skills; Lanvin Group’s ability to develop and maintain effective internal controls; general economic conditions; the result of future financing efforts; and those factors discussed in the reports filed by Lanvin Group from time to time with the SEC. If any of these risks materialize or Lanvin Group’s assumptions prove incorrect, actual results could differ materially from the results implied by these forward-looking statements. There may be additional risks that Lanvin Group presently does not know, or that Lanvin Group currently believes are immaterial, that could also cause actual results to differ from those contained in the forward-looking statements. In addition, forward-looking statements reflect Lanvin Group’s expectations, plans, or forecasts of future events and views as of the date of this communication. Lanvin Group anticipates that subsequent events and developments will cause Lanvin Group’s assessments to change. However, while Lanvin Group may elect to update these forward-looking statements at some point in the future, Lanvin Group specifically disclaim any obligation to do so. These forward-looking statements should not be relied upon as representing Lanvin Group’s assessments of any date subsequent to the date of this communication. Accordingly, reliance should not be placed upon the forward-looking statements.
***
Use of Non-IFRS Financial Metrics
This communication includes certain non-IFRS financial measures such as contribution profit, contribution margin, adjusted earnings before interest and taxes (“Adjusted EBIT”), and adjusted earnings before interest, taxes, depreciation and amortization (“Adjusted EBITDA”). These non-IFRS measures are an addition, and not a substitute for or superior to measures of financial performance prepared in accordance with IFRS and should not be considered as an alternative to net income, operating income or any other performance measures derived in accordance with IFRS. Reconciliations of non-IFRS measures to their most directly comparable IFRS counterparts are included in the Appendix to this communication. Lanvin Group believes that these non-IFRS measures of financial results provide useful supplemental information to investors about Lanvin Group. Lanvin Group believes that the use of these non-IFRS financial measures provides an additional tool for investors to use in evaluating projected operating results and trends in and in comparing Lanvin Group’s financial measures with other similar companies, many of which present similar non-IFRS financial measures to investors. However, there are a number of limitations related to the use of these non-IFRS measures and their nearest IFRS equivalents. For example, other companies may calculate non-IFRS measures differently, or may use other measures to calculate their financial performance, and therefore Lanvin Group’s non-IFRS measures may not be directly comparable to similarly titled measures of other companies. Lanvin Group does not consider these non-IFRS measures in isolation or as an alternative to financial measures determined in accordance with IFRS. The principal limitation of these non-IFRS financial measures is that they exclude significant expenses, income and tax liabilities that are required by IFRS to be recorded in Lanvin Group’s financial statements. In addition, they are subject to inherent limitations as they reflect the exercise of judgements by Lanvin Group about which expense and income are excluded or included in determining these non-IFRS financial measures. In order to compensate for these limitations, Lanvin Group presents non-IFRS financial measures in connection with IFRS results.
***
Enquiries:
Media
Lanvin Group
Miya He
miya.he@lanvin-group.com
Investors
Lanvin Group
James Kim
james.kim@lanvin-group.com
Appendix
Lanvin Group Consolidated Income Statement
(€in Thousands, unless otherwise noted)
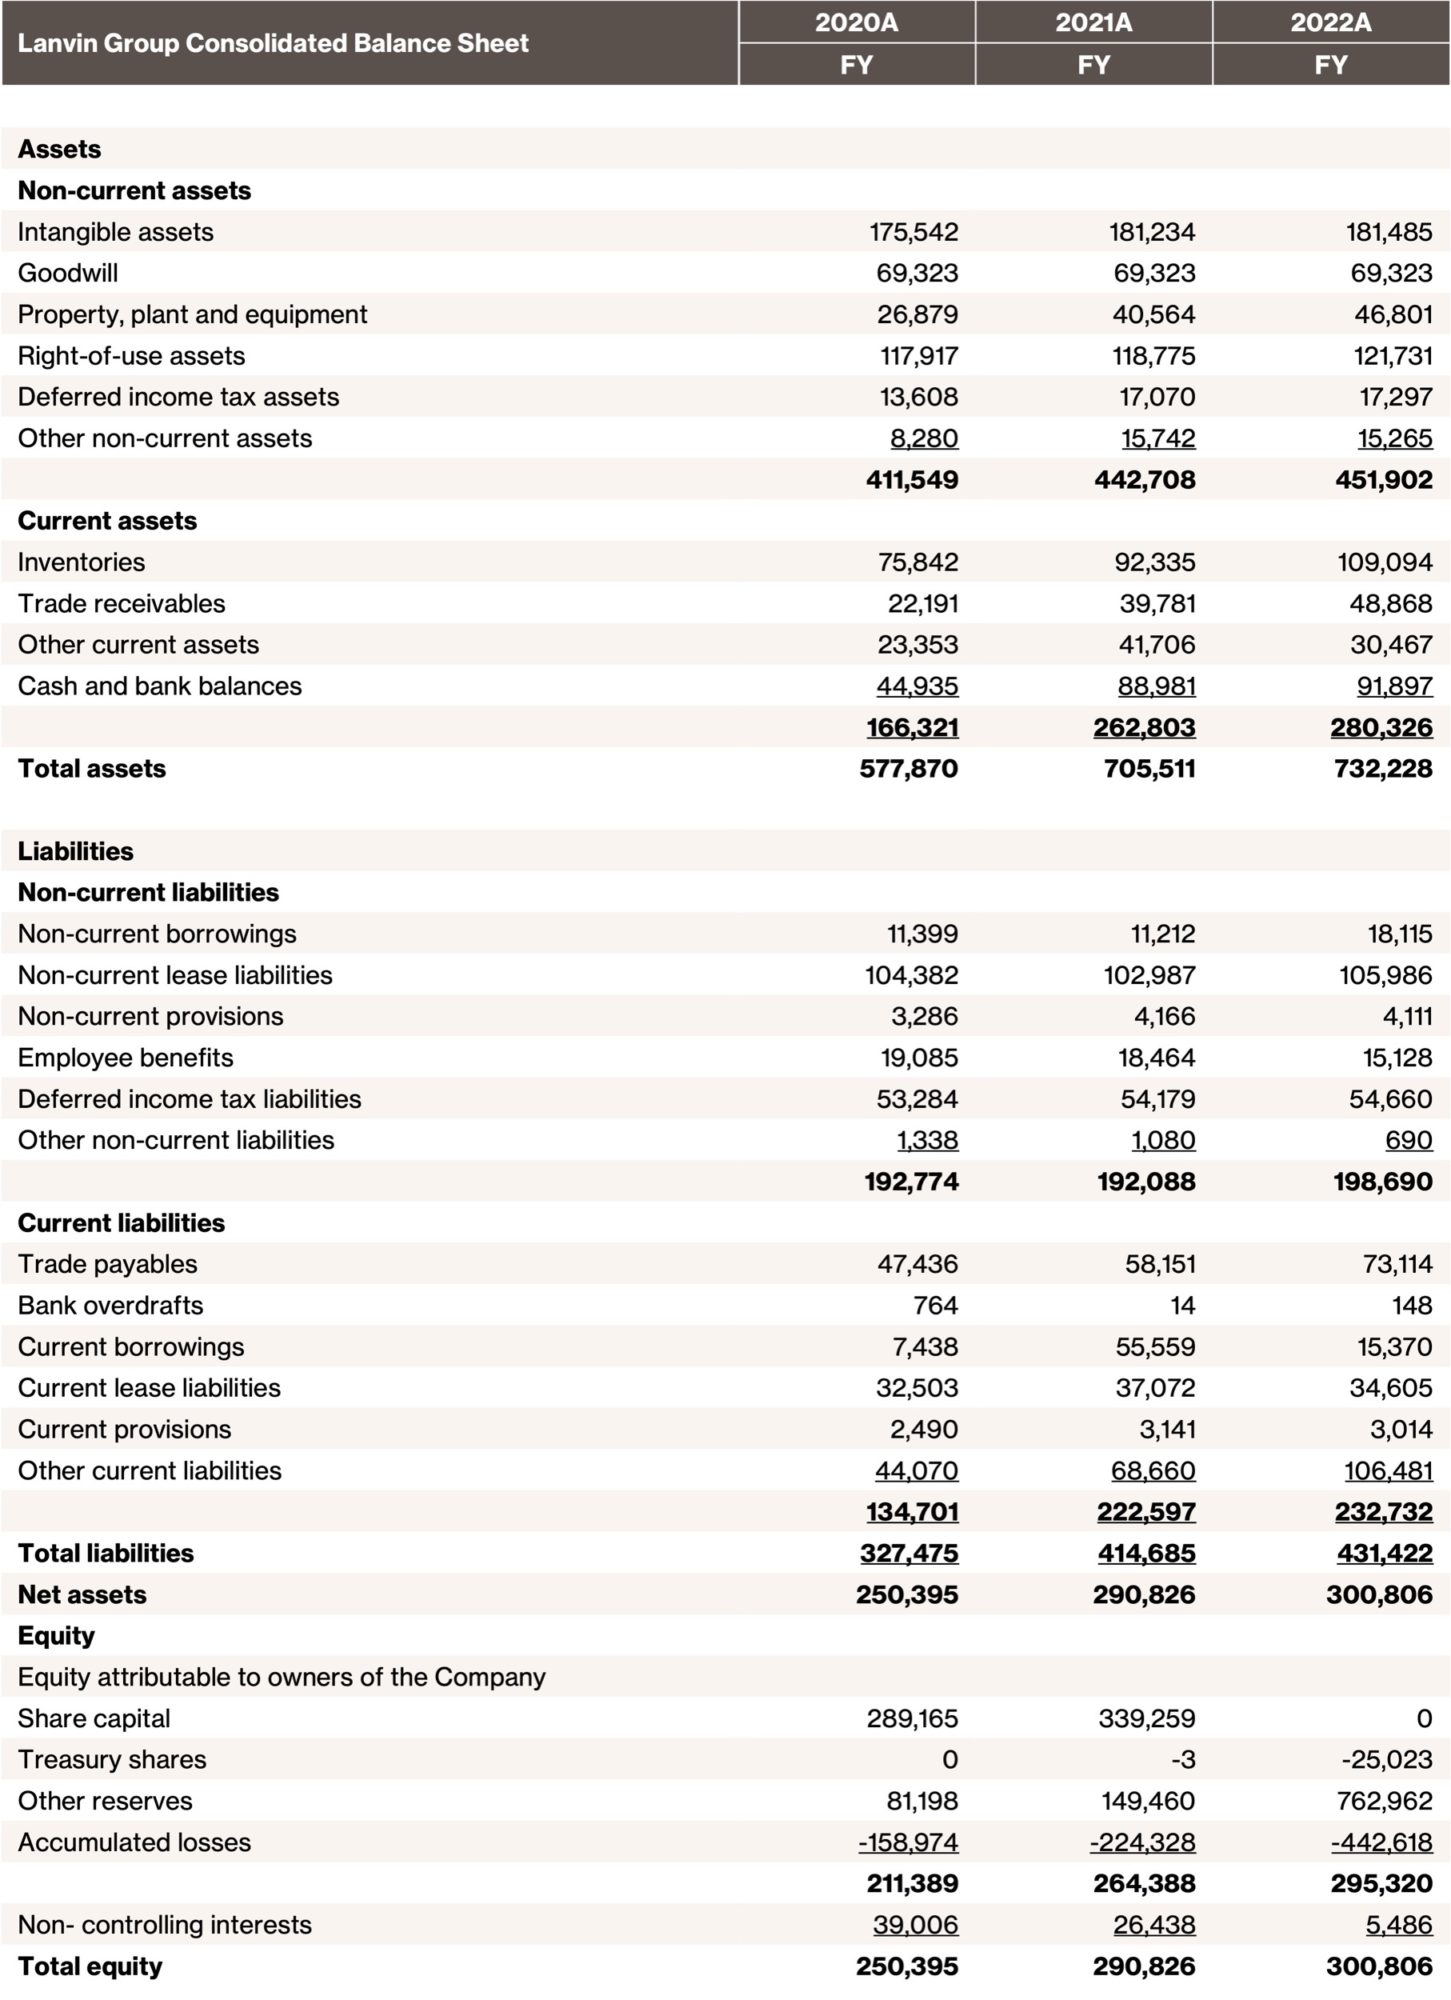
Lanvin Group Consolidated Balance Sheet
(€in Thousands, unless otherwise noted)
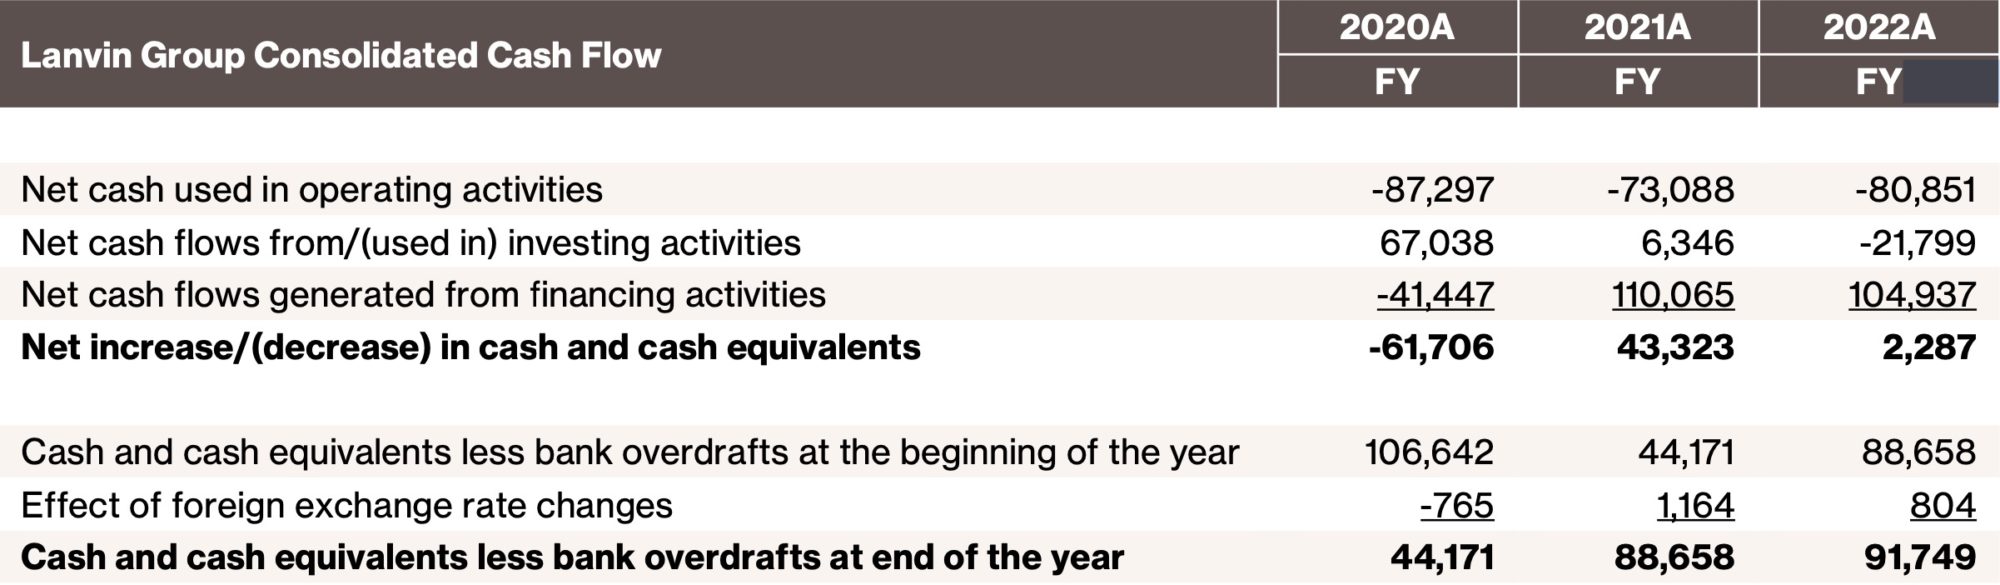
Lanvin Group Consolidated Cash Flow
(€in Thousands, unless otherwise noted)
Lanvin Brand Key Financials(3)
(€in Thousands, unless otherwise noted)
(€ in Thousands, unless otherwise noted)
Wolford Brand Key Financials(3)
(€in Thousands, unless otherwise noted)
Sergio Rossi Brand Key Financials(3)
(€in Thousands, unless otherwise noted)
St. John Brand Key Financials(3)
(€in Thousands, unless otherwise noted)
Caruso Brand Key Financials(3)
(€in Thousands, unless otherwise noted)
Lanvin Group Brand Footprint
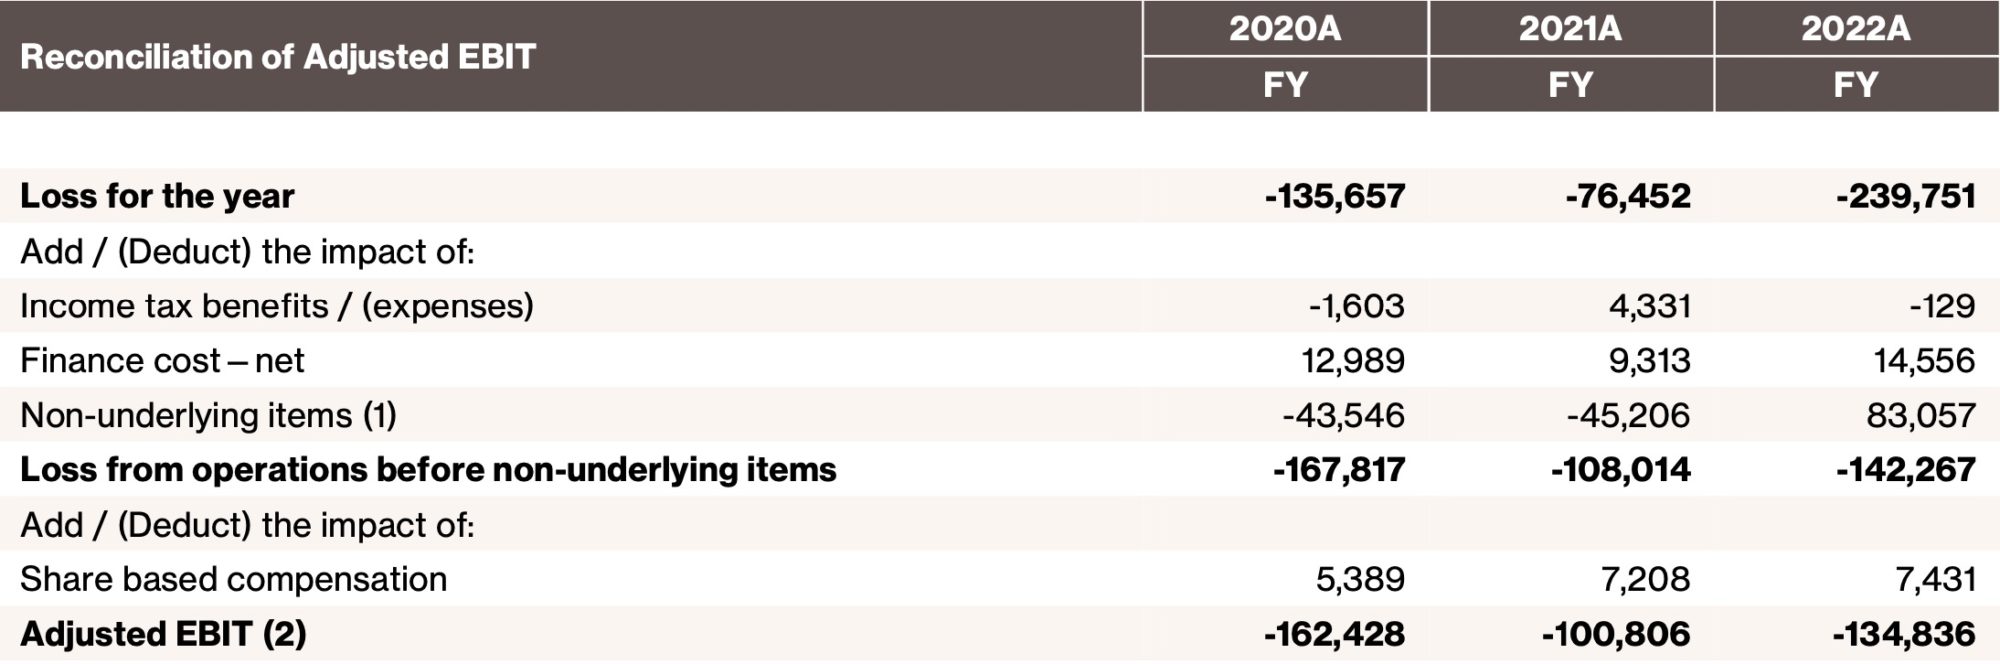
Non-IFRS Financial Measures Reconciliation
(€in Thousands, unless otherwise noted)
(€in Thousands, unless otherwise noted)
(€in Thousands, unless otherwise noted)
Note:
(1) 2022 was impacted by a €84 million cost related to the Reverse Recapitalization that occurred as part of the SPAC merger; this cost is non-recurring in nature.
(2) These are Non-IFRS Financial Measures and will be mentioned throughout this communication. Please see Non-IFRS Financial Measures and Definition.
(3) Brand-level results are presented exclusive of eliminations.
(4) DOS refers to Directly Operated Stores which include boutiques, outlets, concession shop-in-shops and pop-up stores.
(5) POS refers to Point of Sales which include DOS and wholesale accounts.
Non-IFRS Financial Measures and Definition
Our management monitors and evaluates operating and financial performance using several non-IFRS financial measures including: contribution profit, contribution margin, Adjusted EBIT and Adjusted EBITDA. Our management believes that these non-IFRS financial measures provide useful and relevant information regarding our performance and improve their ability to assess financial performance and financial position. They also provide comparable measures that facilitate management’s ability to identify operational trends, as well as make decisions regarding future spending, resource allocations and other operational decisions. While similar measures are widely used in the industry in which we operate, the financial measures that we use may not be comparable to other similarly named measures used by other companies nor are they intended to be substitutes for measures of financial performance or financial position as prepared in accordance with IFRS.
Contribution profit is defined as revenues less the cost of sales and selling and marketing expenses. Contribution profit subtracts the main variable expenses of selling and marketing expenses from gross profit, and our management believes this measure is an important indicator of profitability at the marginal level. Below contribution profit, the main expenses are general administrative expenses and other operating expenses (which include foreign exchange gains or losses and impairment losses). As we continue to improve the management of our portfolio brands, we believe we can achieve greater economy of scale across the different brands by maintaining the fixed expenses at a lower level as a proportion of revenue. We therefore use contribution profit margin as a key indicator of profitability at the group level as well as the portfolio brand level.
Contribution margin is defined as contribution profit divided by revenues.
Adjusted EBIT is defined as profit or loss before income taxes, net finance cost, share based compensation, adjusted for income and costs which are significant in nature and that management considers not reflective of underlying operational activities, mainly including net gains on disposal of long-term assets, negative goodwill from acquisition of Sergio Rossi, gain on debt restructuring and government grants.
Adjusted EBITDA is defined as profit or loss before income taxes, net finance cost, exchange gains/(losses), depreciation, amortization, share based compensation and provisions and impairment losses adjusted for income and costs which are significant in nature and that management considers not reflective of underlying operational activities, mainly including net gains on disposal of long-term assets, negative goodwill from acquisition of Sergio Rossi, gain on debt restructuring and government grants.