Lanvin Group Posts 6.4% Y-o-Y Revenue Growth In H1 2023

Group’s Resilient Business Model Sees Growth Across All Channels and Geographies
- Group Revenue of €215 million for H1 2023, a 6.4% increase over H1 2022
- Group Gross Profit Margin improved to 58.5% and Contribution Profit Margin(1) up significantly to 6.9%; on track to achieve Adjusted EBITDA breakeven in FY2024
- Group Revenue increased in all channels and geographies, with Greater China growing by 13.9%
- Flagship brand Lanvin utilized the first half to transition its creative direction and establish its future; the four brands, excluding Lanvin continued with solid growth of 14.7%, collectively
- Reacquisition of Lanvin’s Japan trademarks successfully completed in March
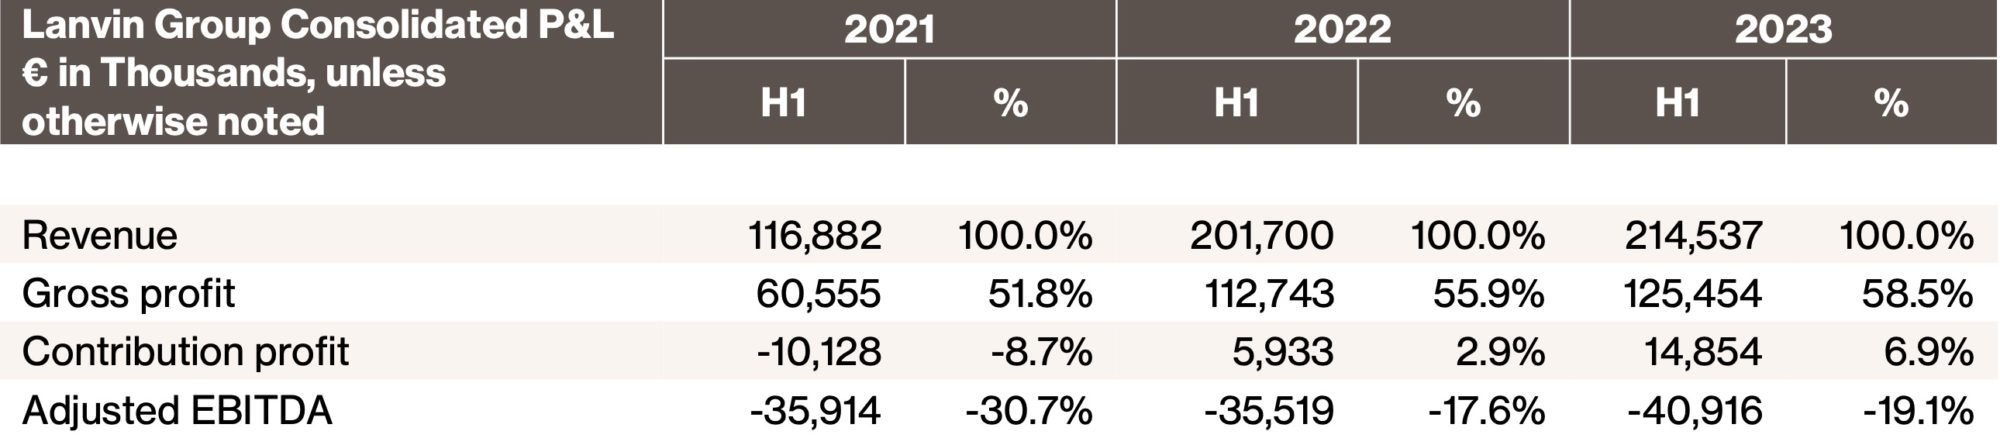
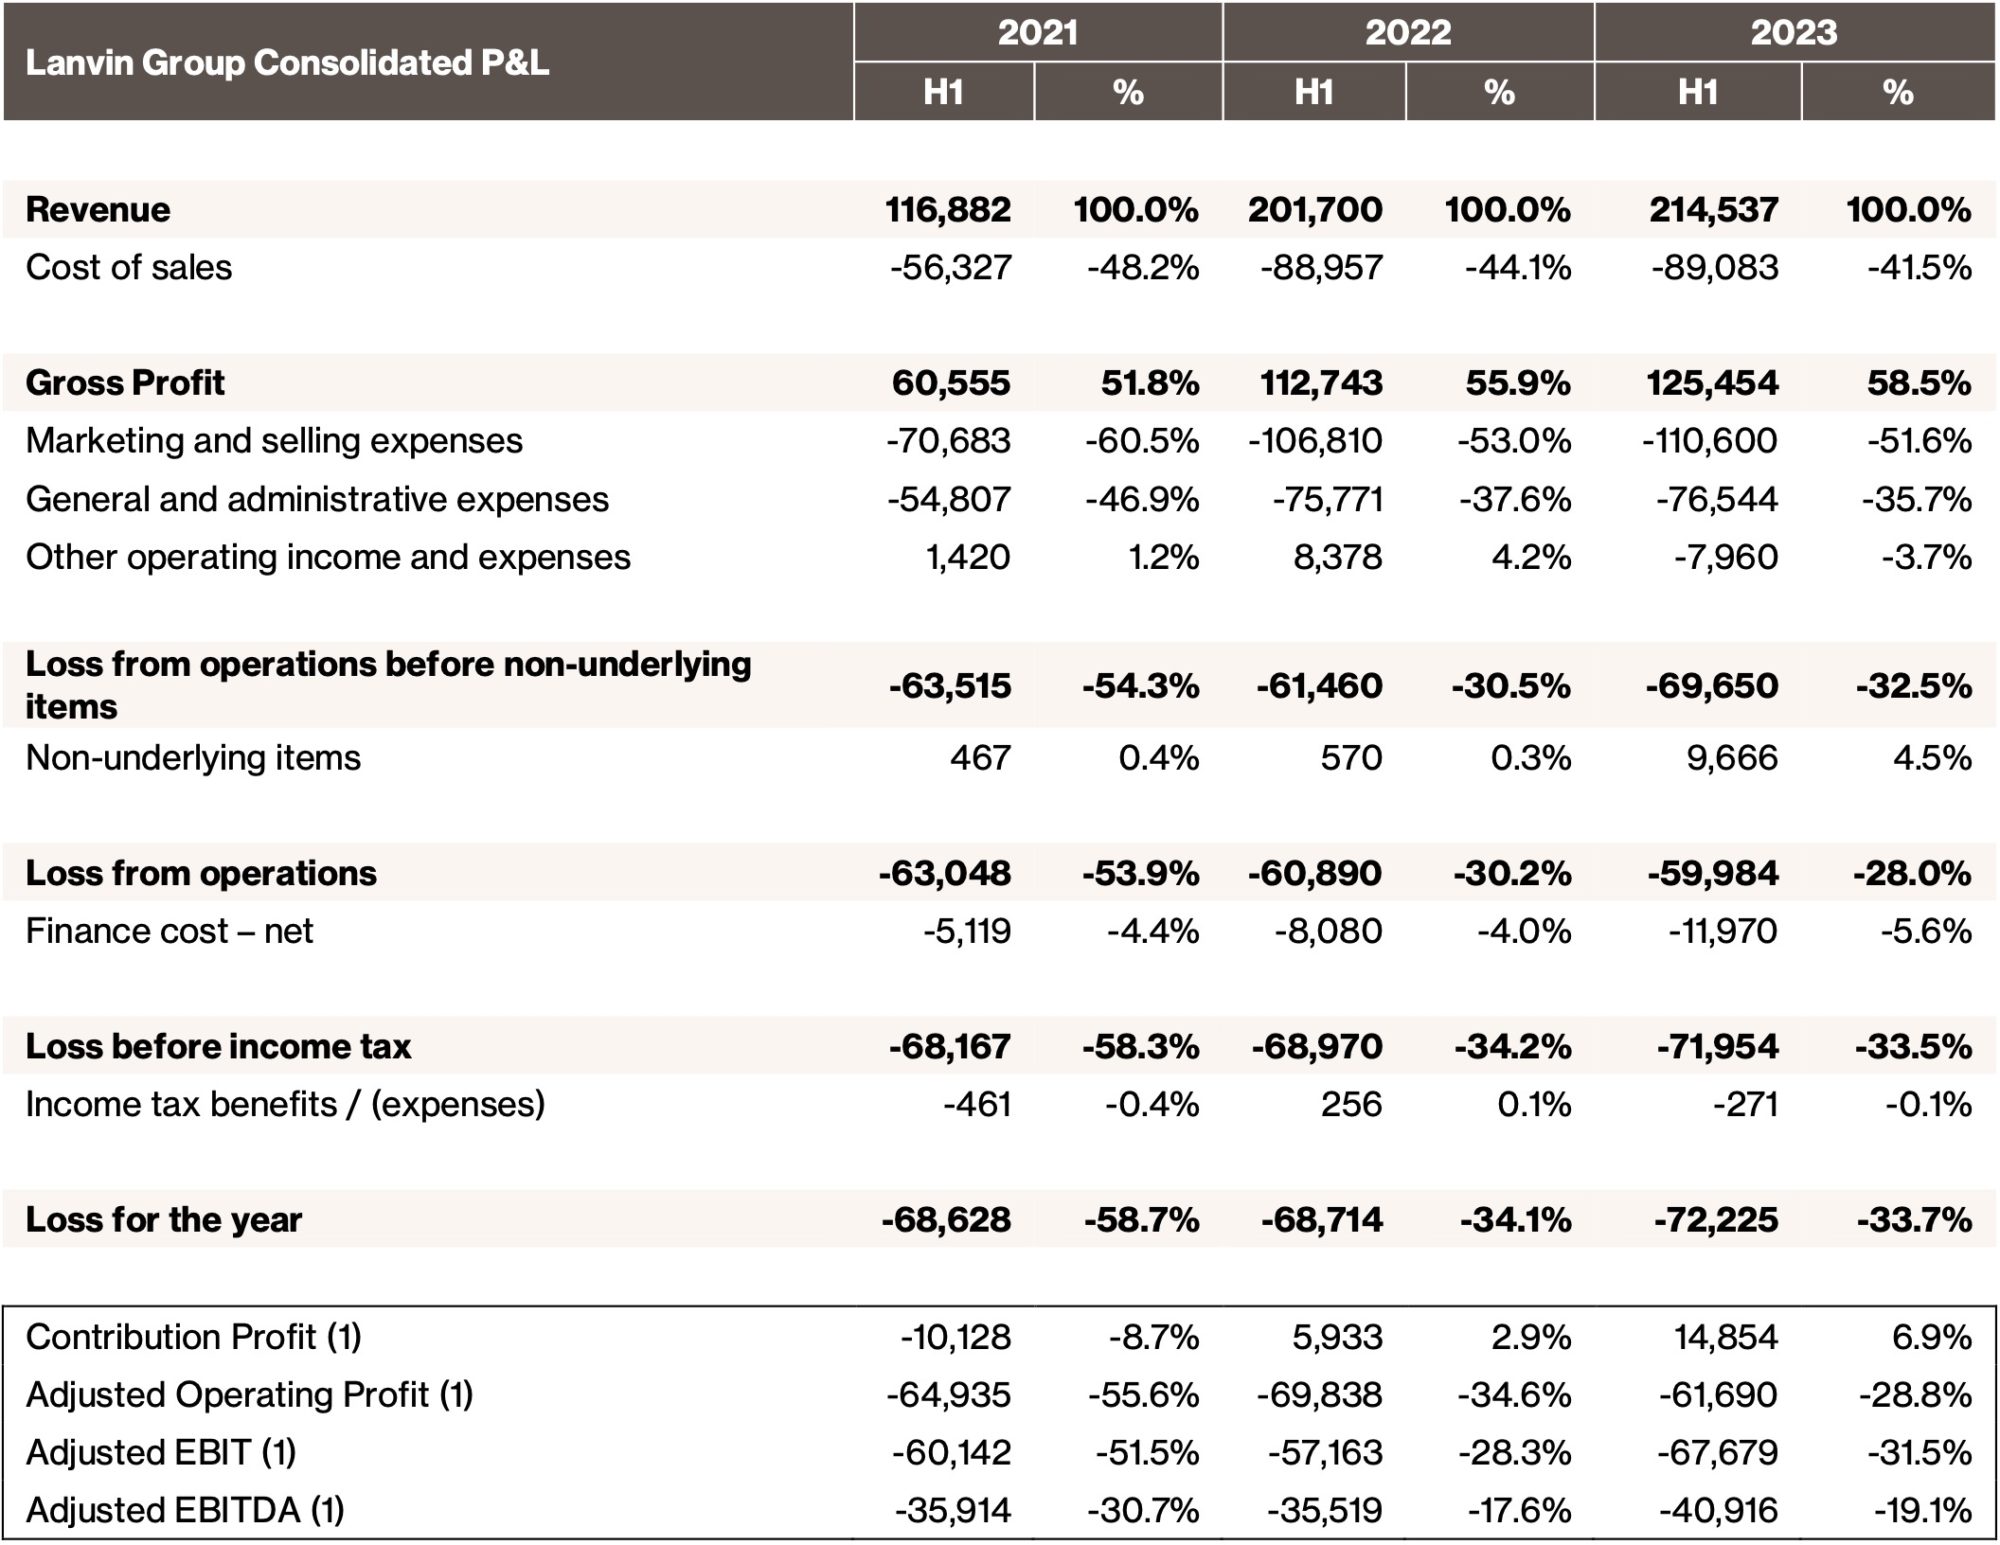
August 30, 2023 – Lanvin Group (NYSE: LANV, the “Group”), a global luxury fashion group with Lanvin, Wolford, Sergio Rossi, St. John and Caruso in its portfolio of brands, today announced its results for the first half of 2023. The Group achieved revenue of €215 million, a 6.4% increase period-over-period versus 2022; and gross profit of €125 million, representing a 58.5% gross profit margin, up from €113 million, and 55.9% gross profit margin in the first half of 2022.
Joann Cheng, Chairman and CEO of Lanvin Group, said: “We continue our track record of global growth while we make progress on our path to profitability. Our improvement in gross profit and contribution profit are evidence of our commitment to securing profitable growth. We have done the groundwork for our brands to accelerate their growth and are excited about our prospects for the remainder of 2023.”
Ms. Cheng continued, “At the top line, we grew group revenues across all our key markets with Sergio Rossi growing sales by 22.4% and Wolford growing 8.4%, especially after the hiring of Nao Takekoshi as its Creative Director. We also made several strategic reorganization decisions with respect to Lanvin which had an expected short-term impact in the first half of 2023. We believe we have now placed Lanvin in a much stronger position and look forward to seeing the results of these decisions, such as a new collection from our first Lanvin Lab guest designer, the Grammy-winning artist, Future.”
Review of the First Half 2023 Results
Selected Highlights
Consistent growth for the Group: Revenue in all regions and by all channels grew. Greater China grew 13.9%, EMEA grew 5.3%, and North America was up 2.6%. Outside Greater China, Asia grew 27.1%. Lanvin started the year slowly while executing a creative reorganization, but the rest of the Group grew 14.7%, period-over-period.
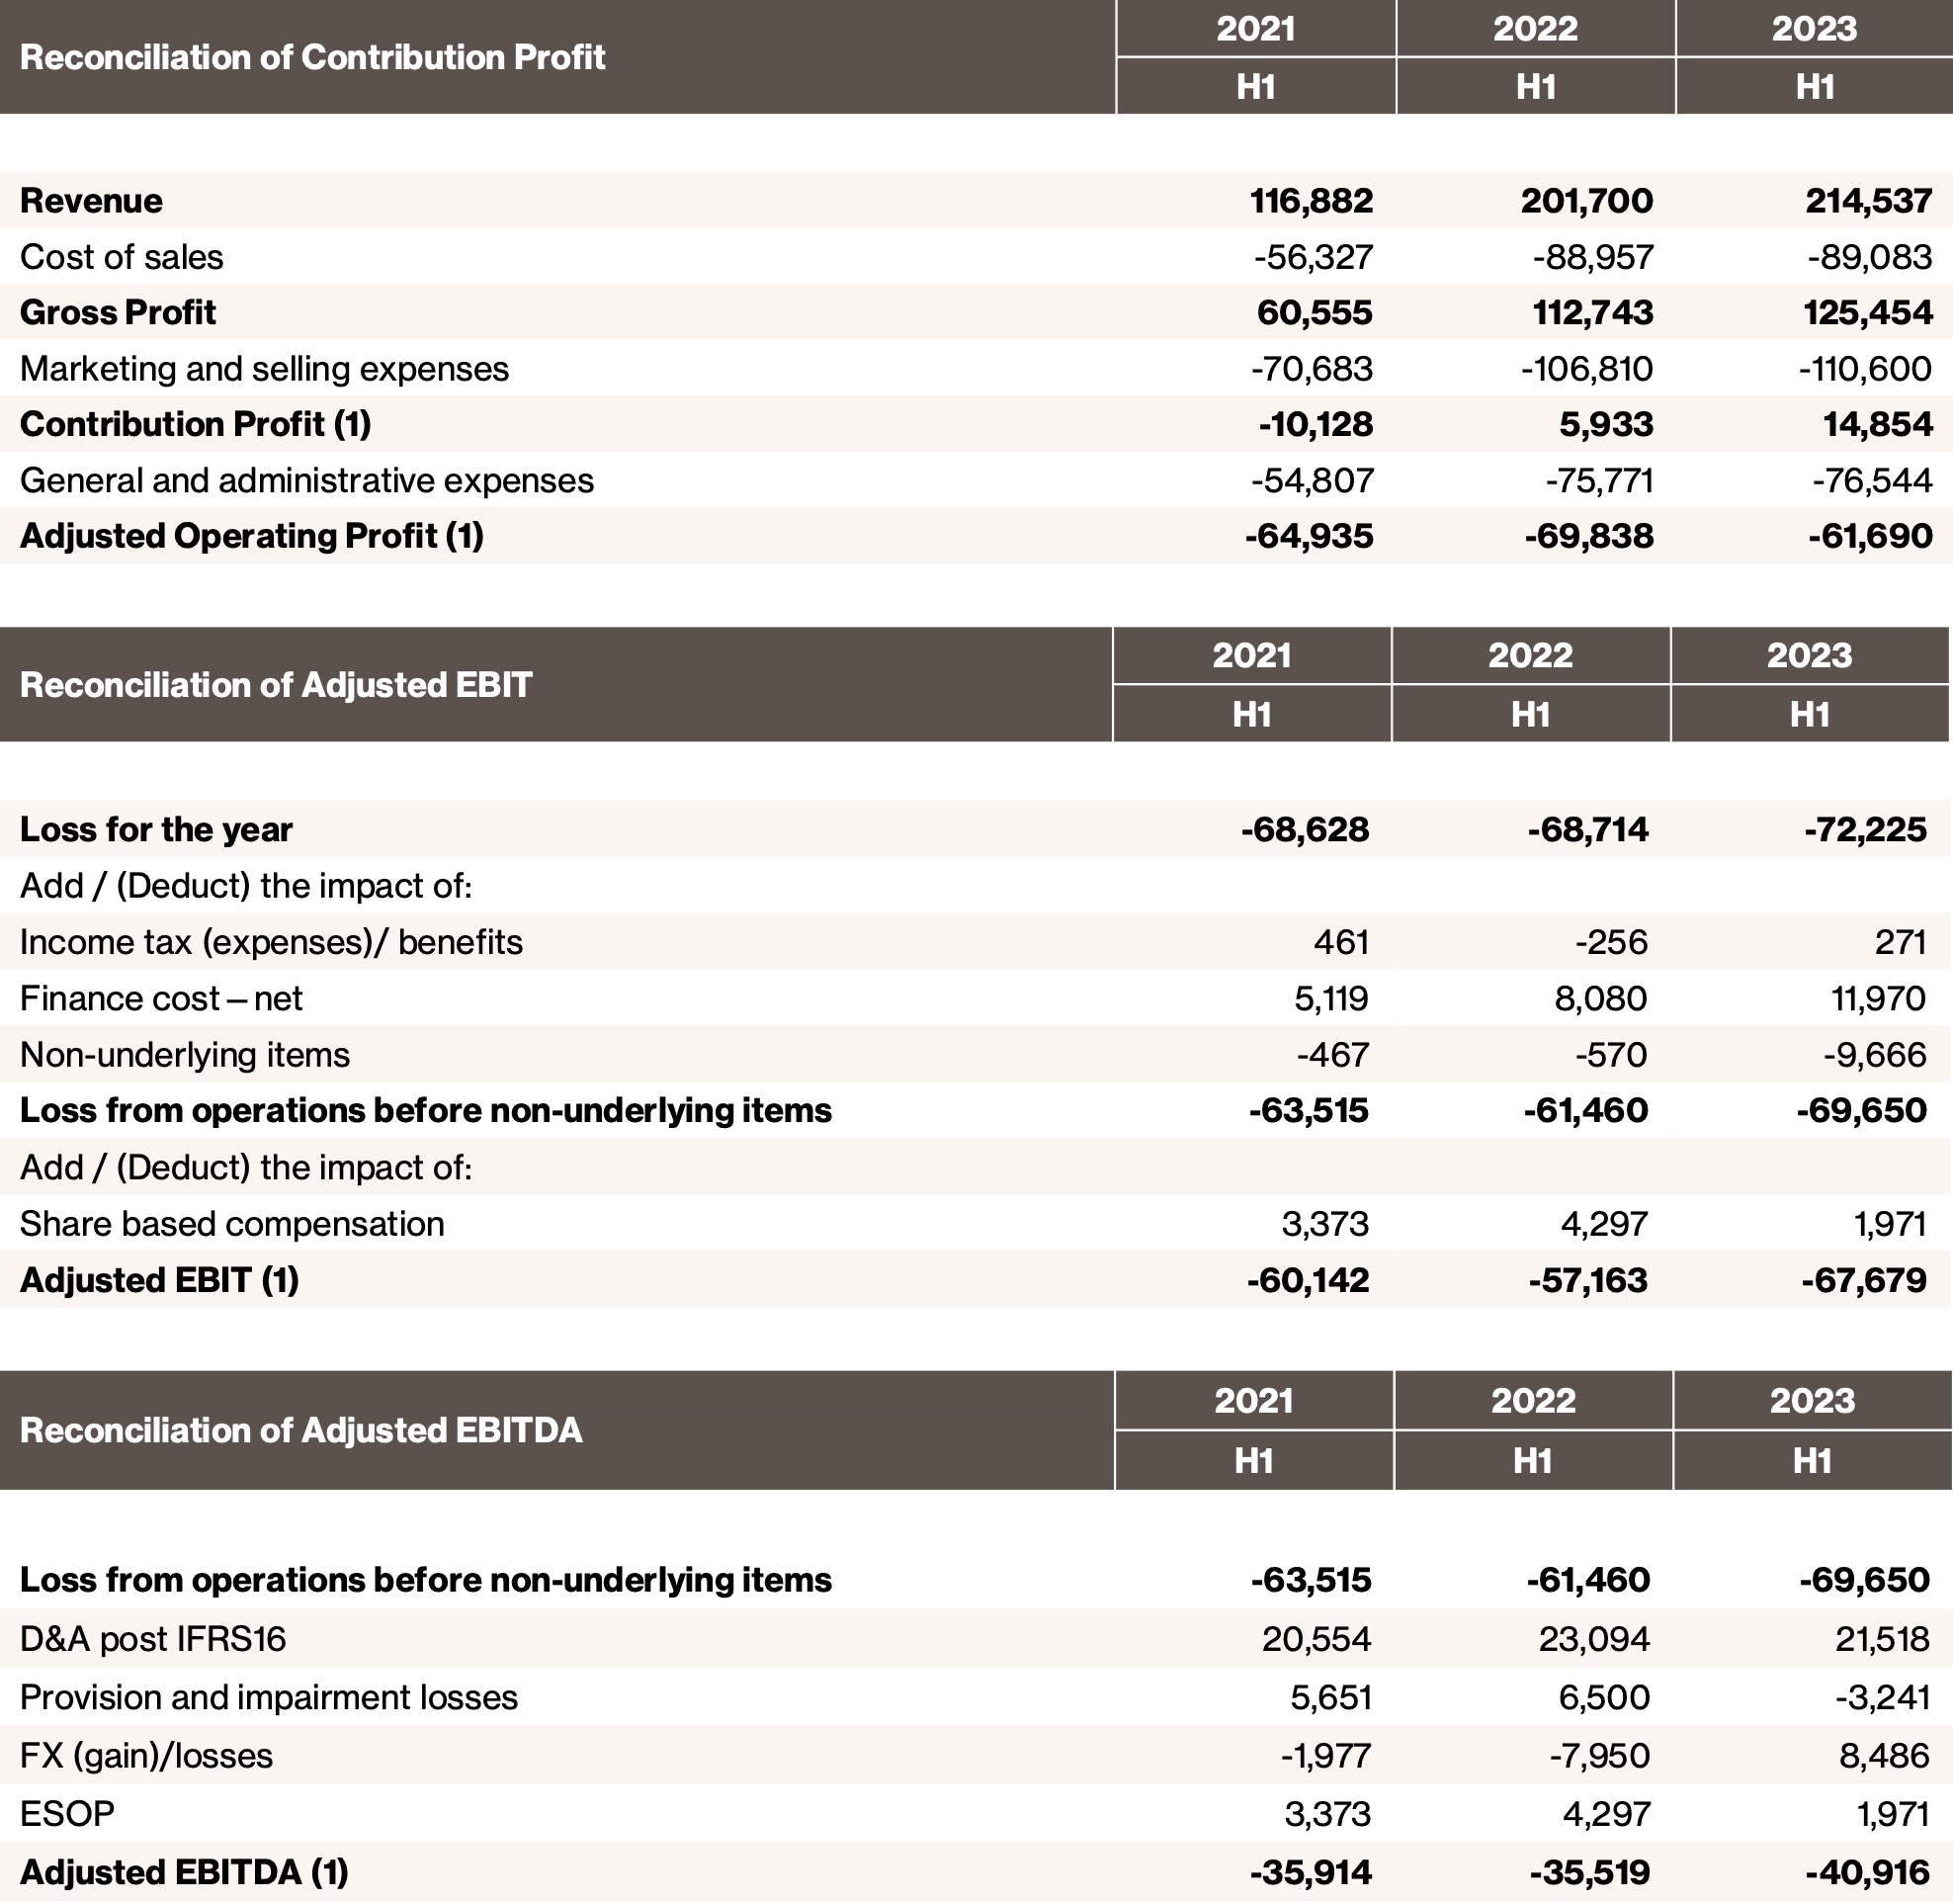
Continued positive progress with margin profile: Gross profit margin increased to 58.5% and contribution profit reached a Group record of €15 million, a 6.9% margin. Operational improvement strategies are showing results and will continue to drive margin improvement in the second half of the year, keeping the Group on track to reach breakeven Adjusted EBITDA in 2024.
Reacquisition of Lanvin’s Japan trademarks: Lanvin reacquired its Japan trademarks from its strategic partner, Itochu Corporation in March, to further integrate its global IP and management. Itochu Corporation built a highly successful licensed business in Japan over the past 20 years, and it will continue to support Lanvin’s future development in this market as its exclusive licensee and distributor for Japan.
New organizational and personnel announcements: With global trends evolving, Lanvin made a strategic decision to take a new creative direction in April. Together with the departure of its former Creative Director Bruno Sialelli, Lanvin announced the establishment of two new organizational structures alongside the development of its main ready-to-wear collection: Leather Goods & Accessories and Lanvin Lab. Lanvin Lab is an experimental space inviting creative partnerships with proven and rising international talents that challenge and reinforce the house’s cultural values and position. Lanvin Lab has announced Future, the Grammy-winning artist, as its first guest creative director and will launch its inaugural collection in the second half of 2023.
In February, Wolford announced its new Creative Director, Nao Takekoshi, a highly successful industry veteran who began his career at Issey Miyake and went on to work with brands such as Cerruti, Gucci, Donna Karan, Jil Sander and Calvin Klein. Mr. Takekoshi’s arrival marks an important step in the development of Wolford’s strategy, which is based on strengthening and modernizing the brand’s iconic style while shaping it into a global brand.
Review of First Half 2023 Financials
Revenue
For H1 2023, the Group generated revenue of €215 million, a 6.4% increase period-over-period. DTC channel revenue increased by 5.1% and Wholesale revenue increased by 2.2%. Other revenue growth was driven by royalty income, from the reacquisition of the Lanvin Japan trademarks, and clearance income. Regional revenue also increased across the board with Greater China growing at 13.9% (Asia excluding Greater China grew by 27.1%), EMEA growing at 5.3%, and North America increasing by 2.6%.
Gross Profit
Gross profit increased to €125 million, representing a 58.5% margin versus €113 million for H1 2022 at a margin of 55.9%. The Group continues to focus on scale, and product and distribution management to drive its gross profit margin.
Contribution Profit(1)
The Group showed significant improvement in contribution profit at €15 million, a 6.9% margin versus €6 million for H1 2022 at a margin of 2.9%, a period-over-period increase of 150.4%. The Group uses this variable profitability metric as a barometer for operating performance and key performance indicator for its operational and cost initiatives.
Adjusted EBITDA
Adjusted EBITDA for the Group declined to -€41 million versus -€36 million for H1 2022, mainly driven by lower revenue at Lanvin, and the resulting reduction in cost absorption. Additionally, investments in selling and marketing expenses increased for the establishment of Lanvin Lab; physical fashion shows versus digital, the previous year; and other initiatives planned for the second half of 2023.
Results by Segment
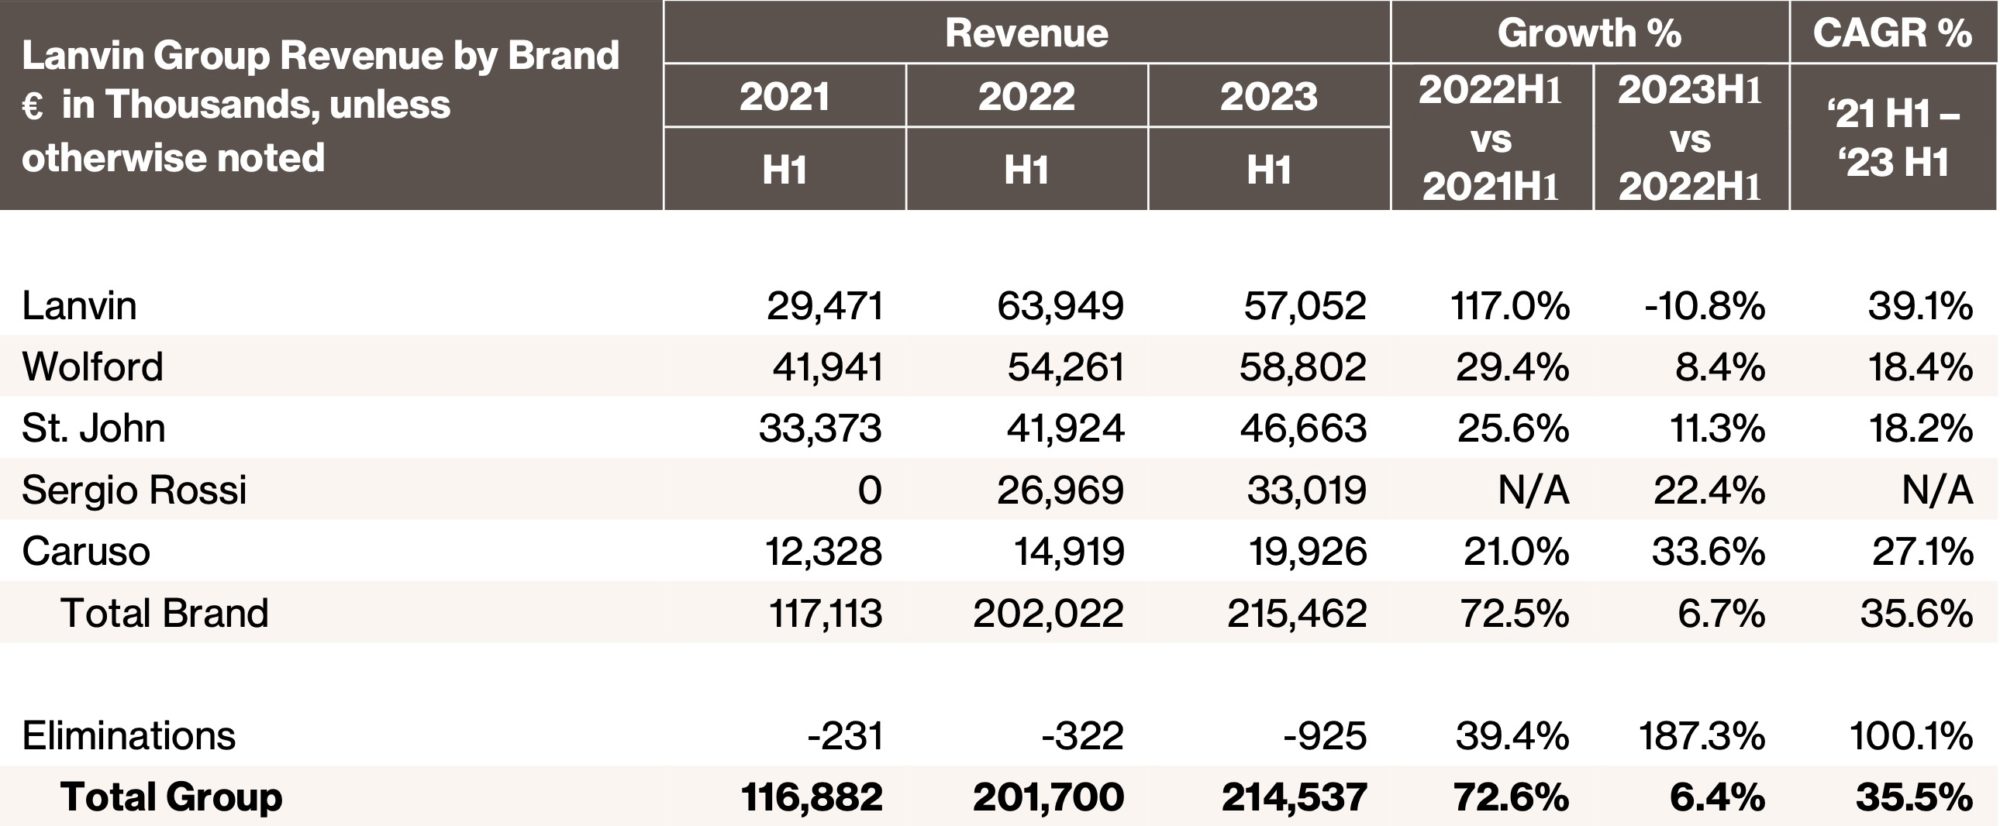
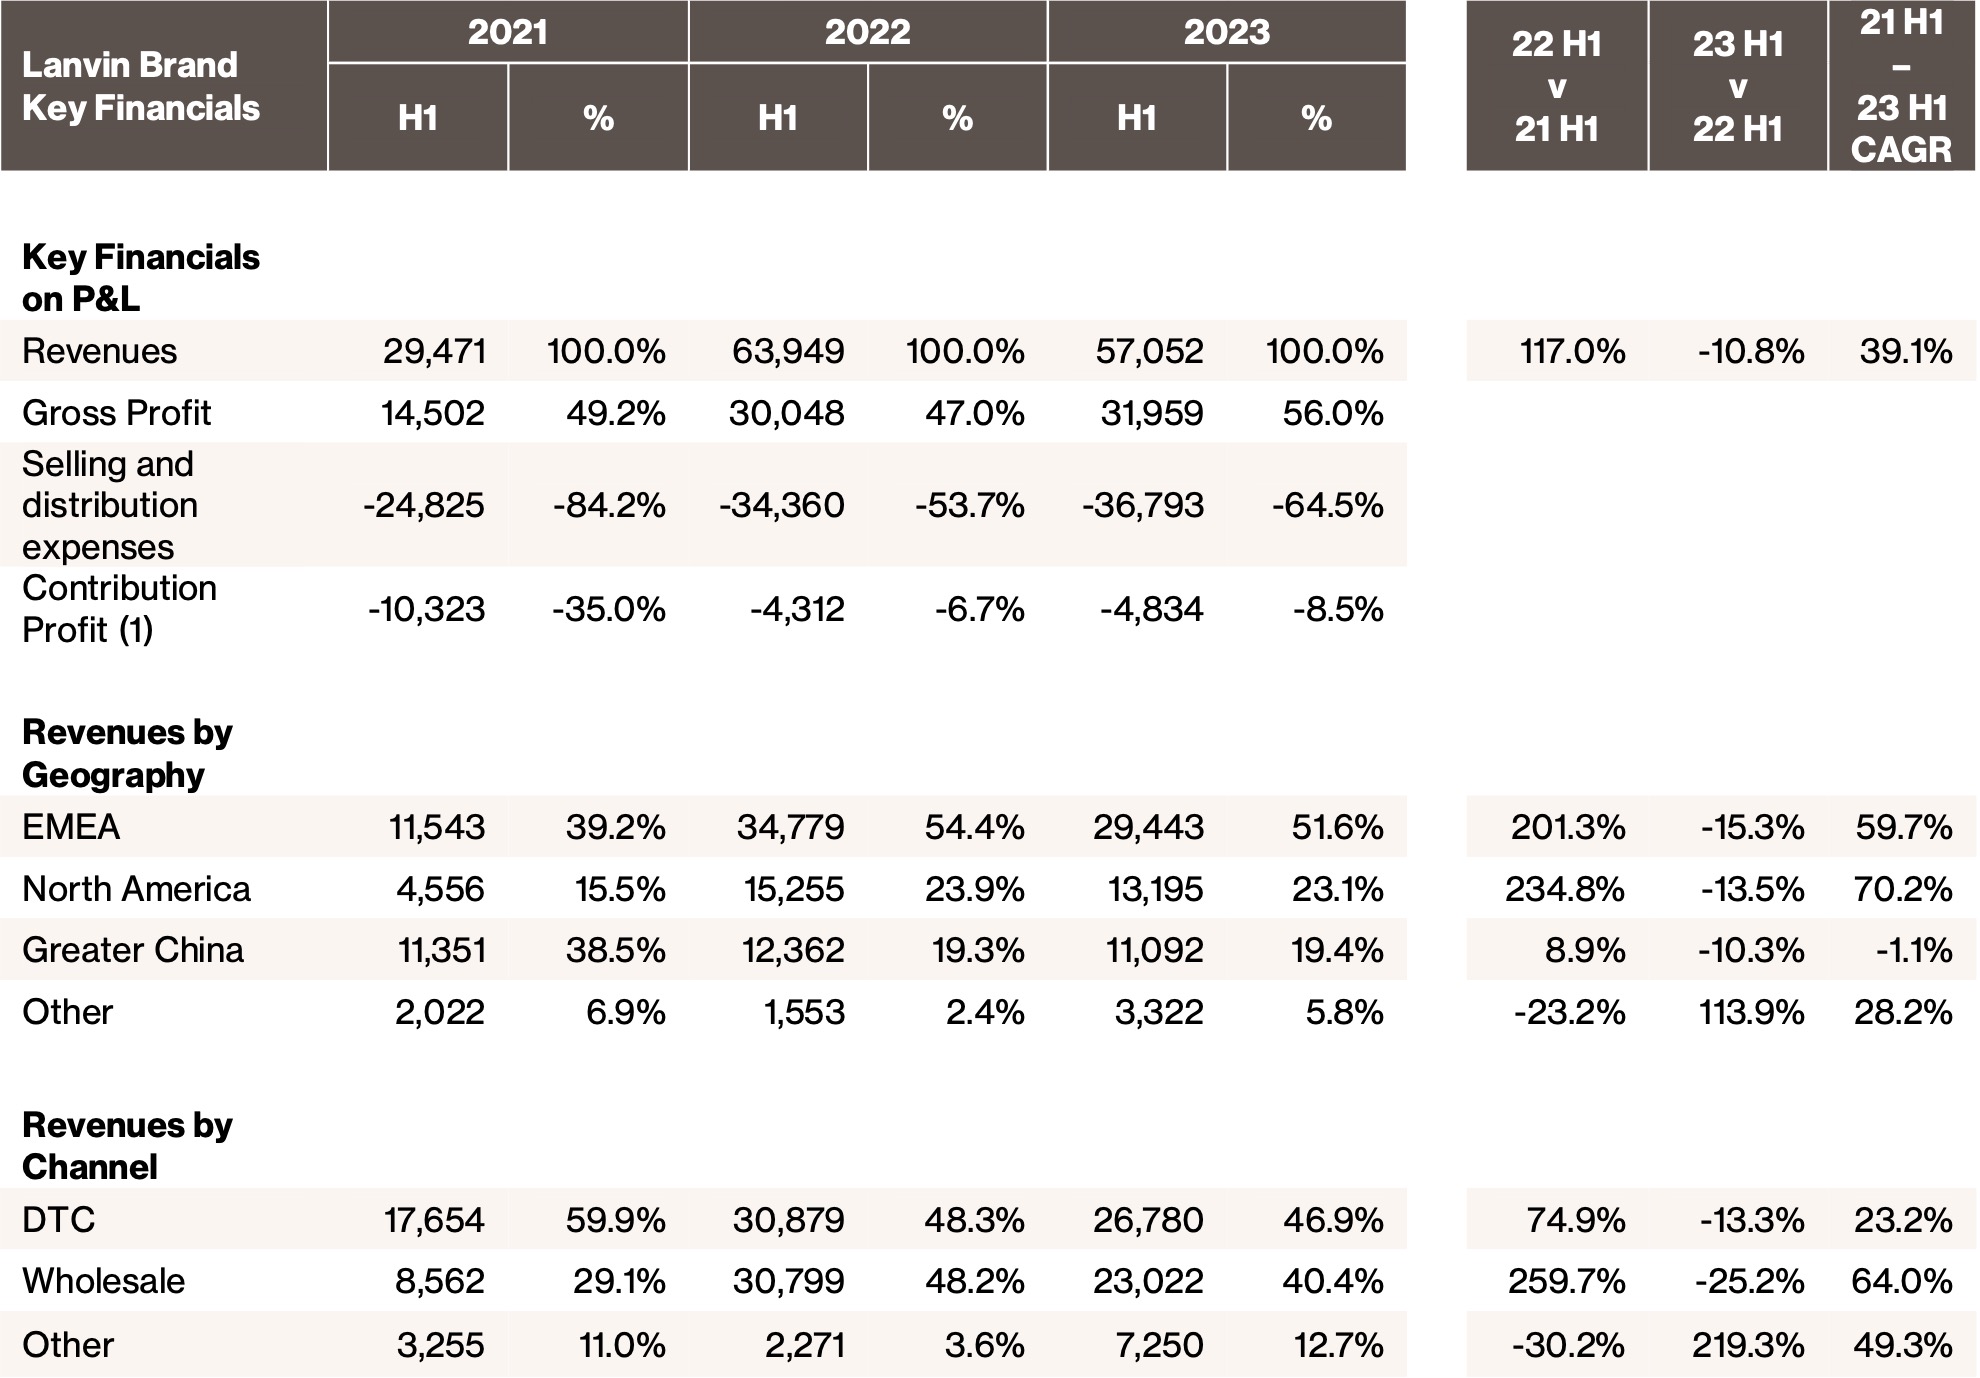
Lanvin: Revenue decreased from €64 million in H1 2022 to €57 million in H1 2023, mainly due to its focus on a creative transition as well as comparatively fewer key product and marketing initiatives in H1 2023 versus H1 2022. As part of its creative transition, the brand established Lanvin Lab, and a dedicated team for leather goods and accessories, with plans for initiatives to launch in the second half of 2023.
The brand plans to announce a new Artistic Director in the coming months who will work alongside Lanvin Lab. The new Artistic Director and Lanvin Lab will work in tandem to drive brand heat more consistently going forward. With these changes, the brand has set its foundation for the future.
Gross profit increased to €32 million from €30 million from higher contribution of DTC revenue and accessory categories. Contribution profit remained stable from a contribution loss of €4 million in H1 2022 to a contribution loss of €5 million in H1 2023.
The second half is poised for accelerated growth from key product launches, collaborations, and marketing initiatives, as well as the opening of the new New York City flagship store on Madison Avenue and entry into the Middle East market.
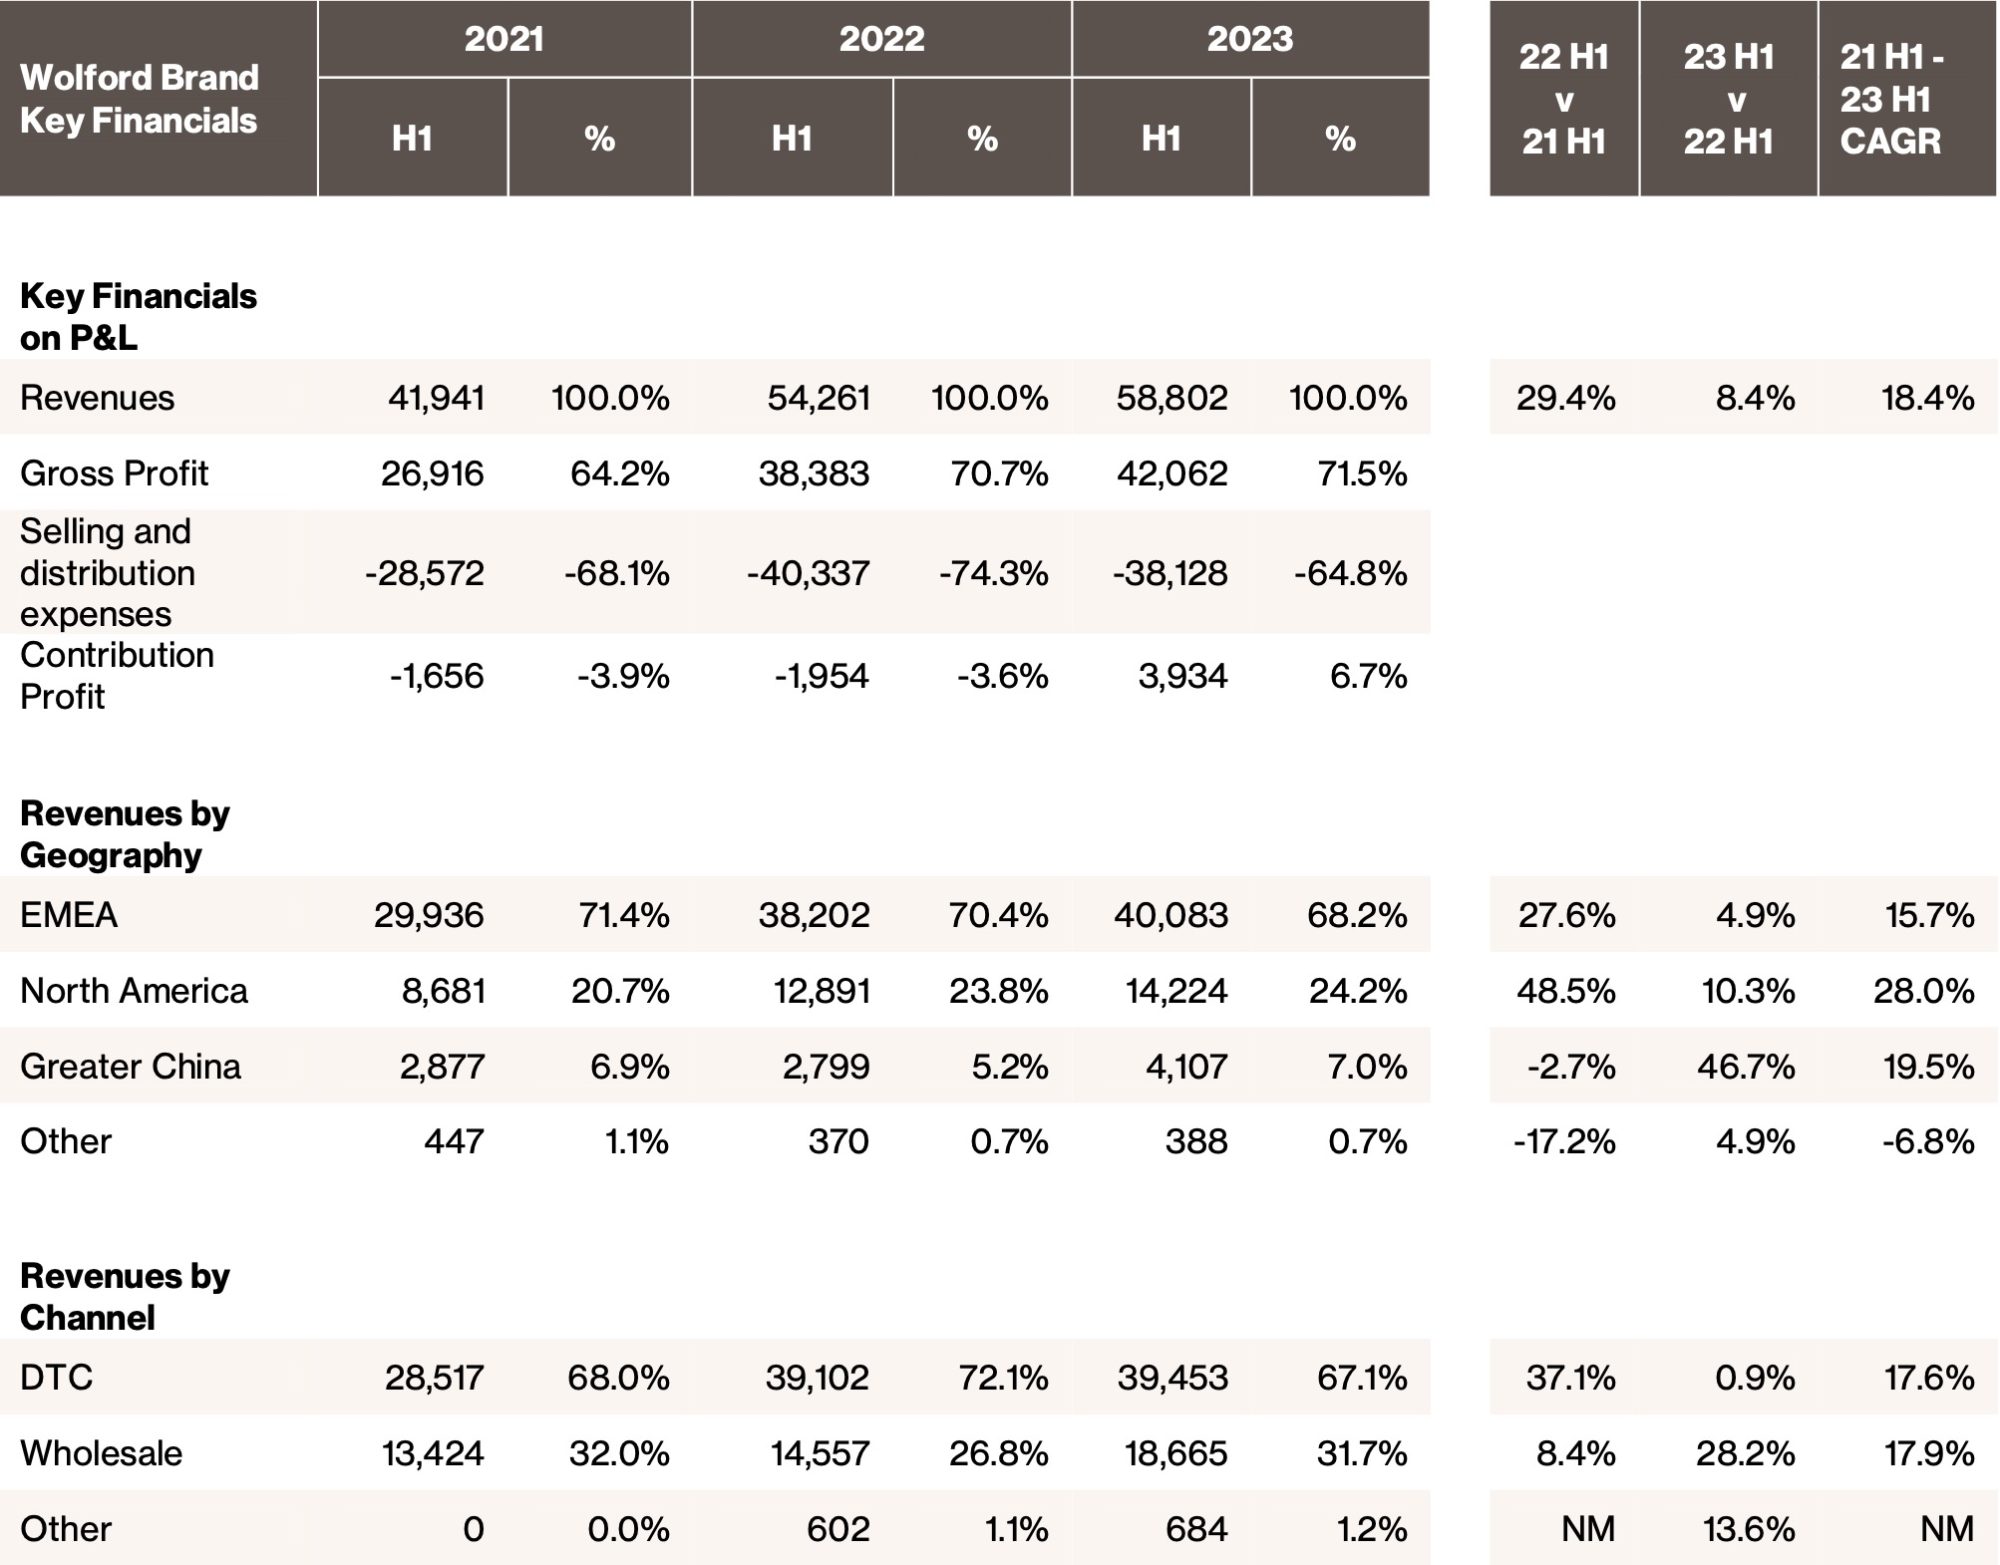
Wolford: Revenue grew at 8.4% increasing from €54 million in H1 2022 to €59 million in H1 2023. Greater China grew 46.7%, while North America grew at 10.3% and EMEA increased by 4.9%. Wholesale revenue, which included new franchise locations, was up 28.2% from price increases and organic growth.
Gross profit margin increased to 71.5% from 70.7%. Contribution profit increased, turning positive to €4 million from a loss of €2 million and margin increasing from -3.6% to 6.7%, thanks to the increased sales, higher gross profit margin, and lower marketing and selling expenses.
The brand growth was highlighted with the continued strong growth of The W collections, the special capsule with N°21, as well as a powerful campaign starring legendary singer and style icon Grace Jones, whose bold sense of confidence and unique performances have inspired women for generations. We expect product innovations and new launches to continue driving the brand forward in the second half of 2023.
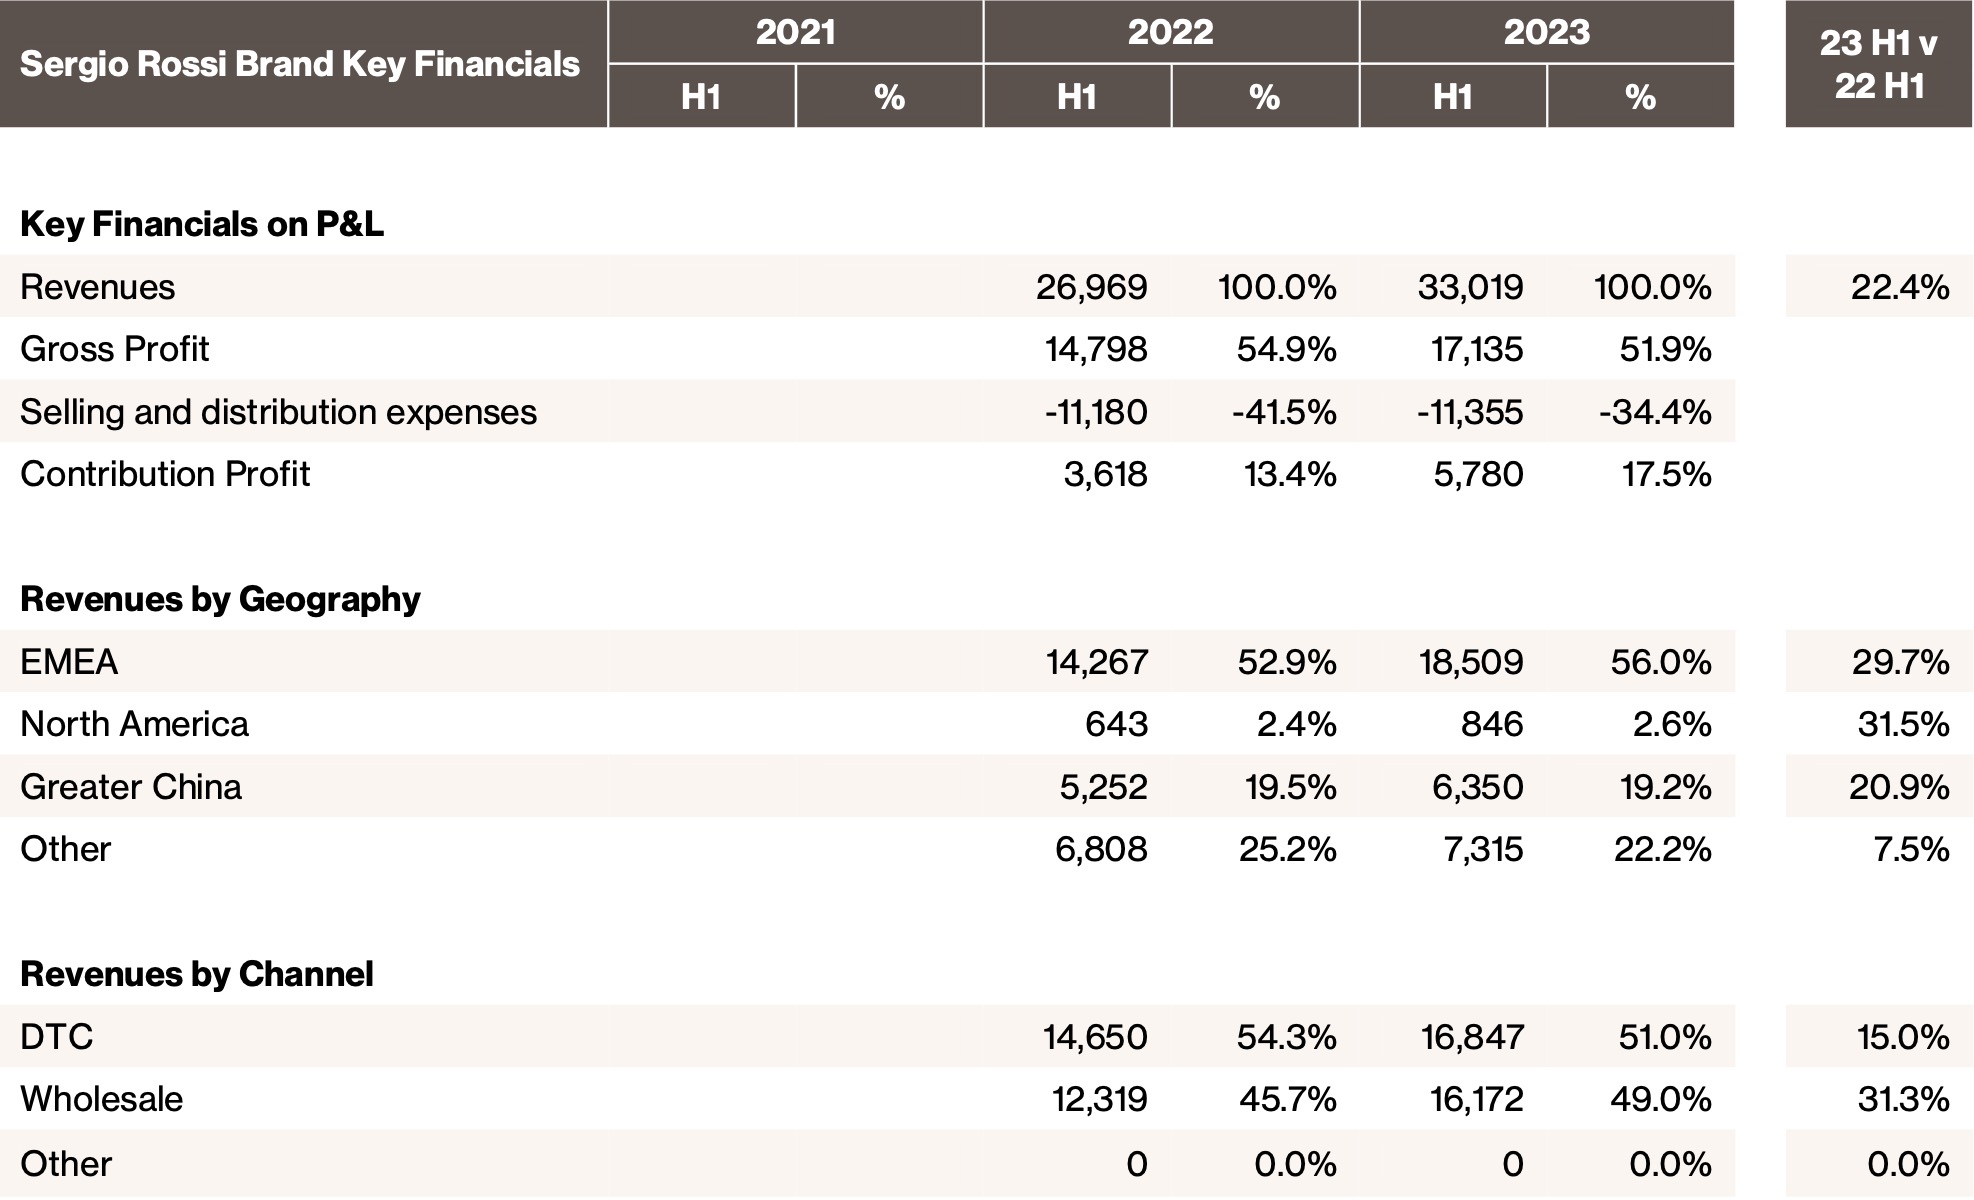
Sergio Rossi: Sergio Rossi revenue increased from €27 million in H1 2022 to €33 million in H1 2023, a growth of 22.4%. The brand had 29.7% growth in EMEA and 31.5% growth in North American regions as well as 20.9% in Greater China, a key market. New product launches including the collaboration with AREA – the breakout apparel brand from New York, as well as the special campaign with Japanese artist Mari Katayama who has walked with prosthetic legs since the age of nine has generated continuous brand heat.
Gross profit margin decreased from 54.9% to 51.9%, period-over-period due to a 31.3% increase in Wholesale revenue for the period, while DTC revenue grew 15.0%. Wholesale revenue increased mainly from increased orders for production for third-parties, which Sergio Rossi includes in Wholesale revenue. Contribution profit margin improved from 13.4% to 17.5% driven by operating leverage from the increase in revenue.
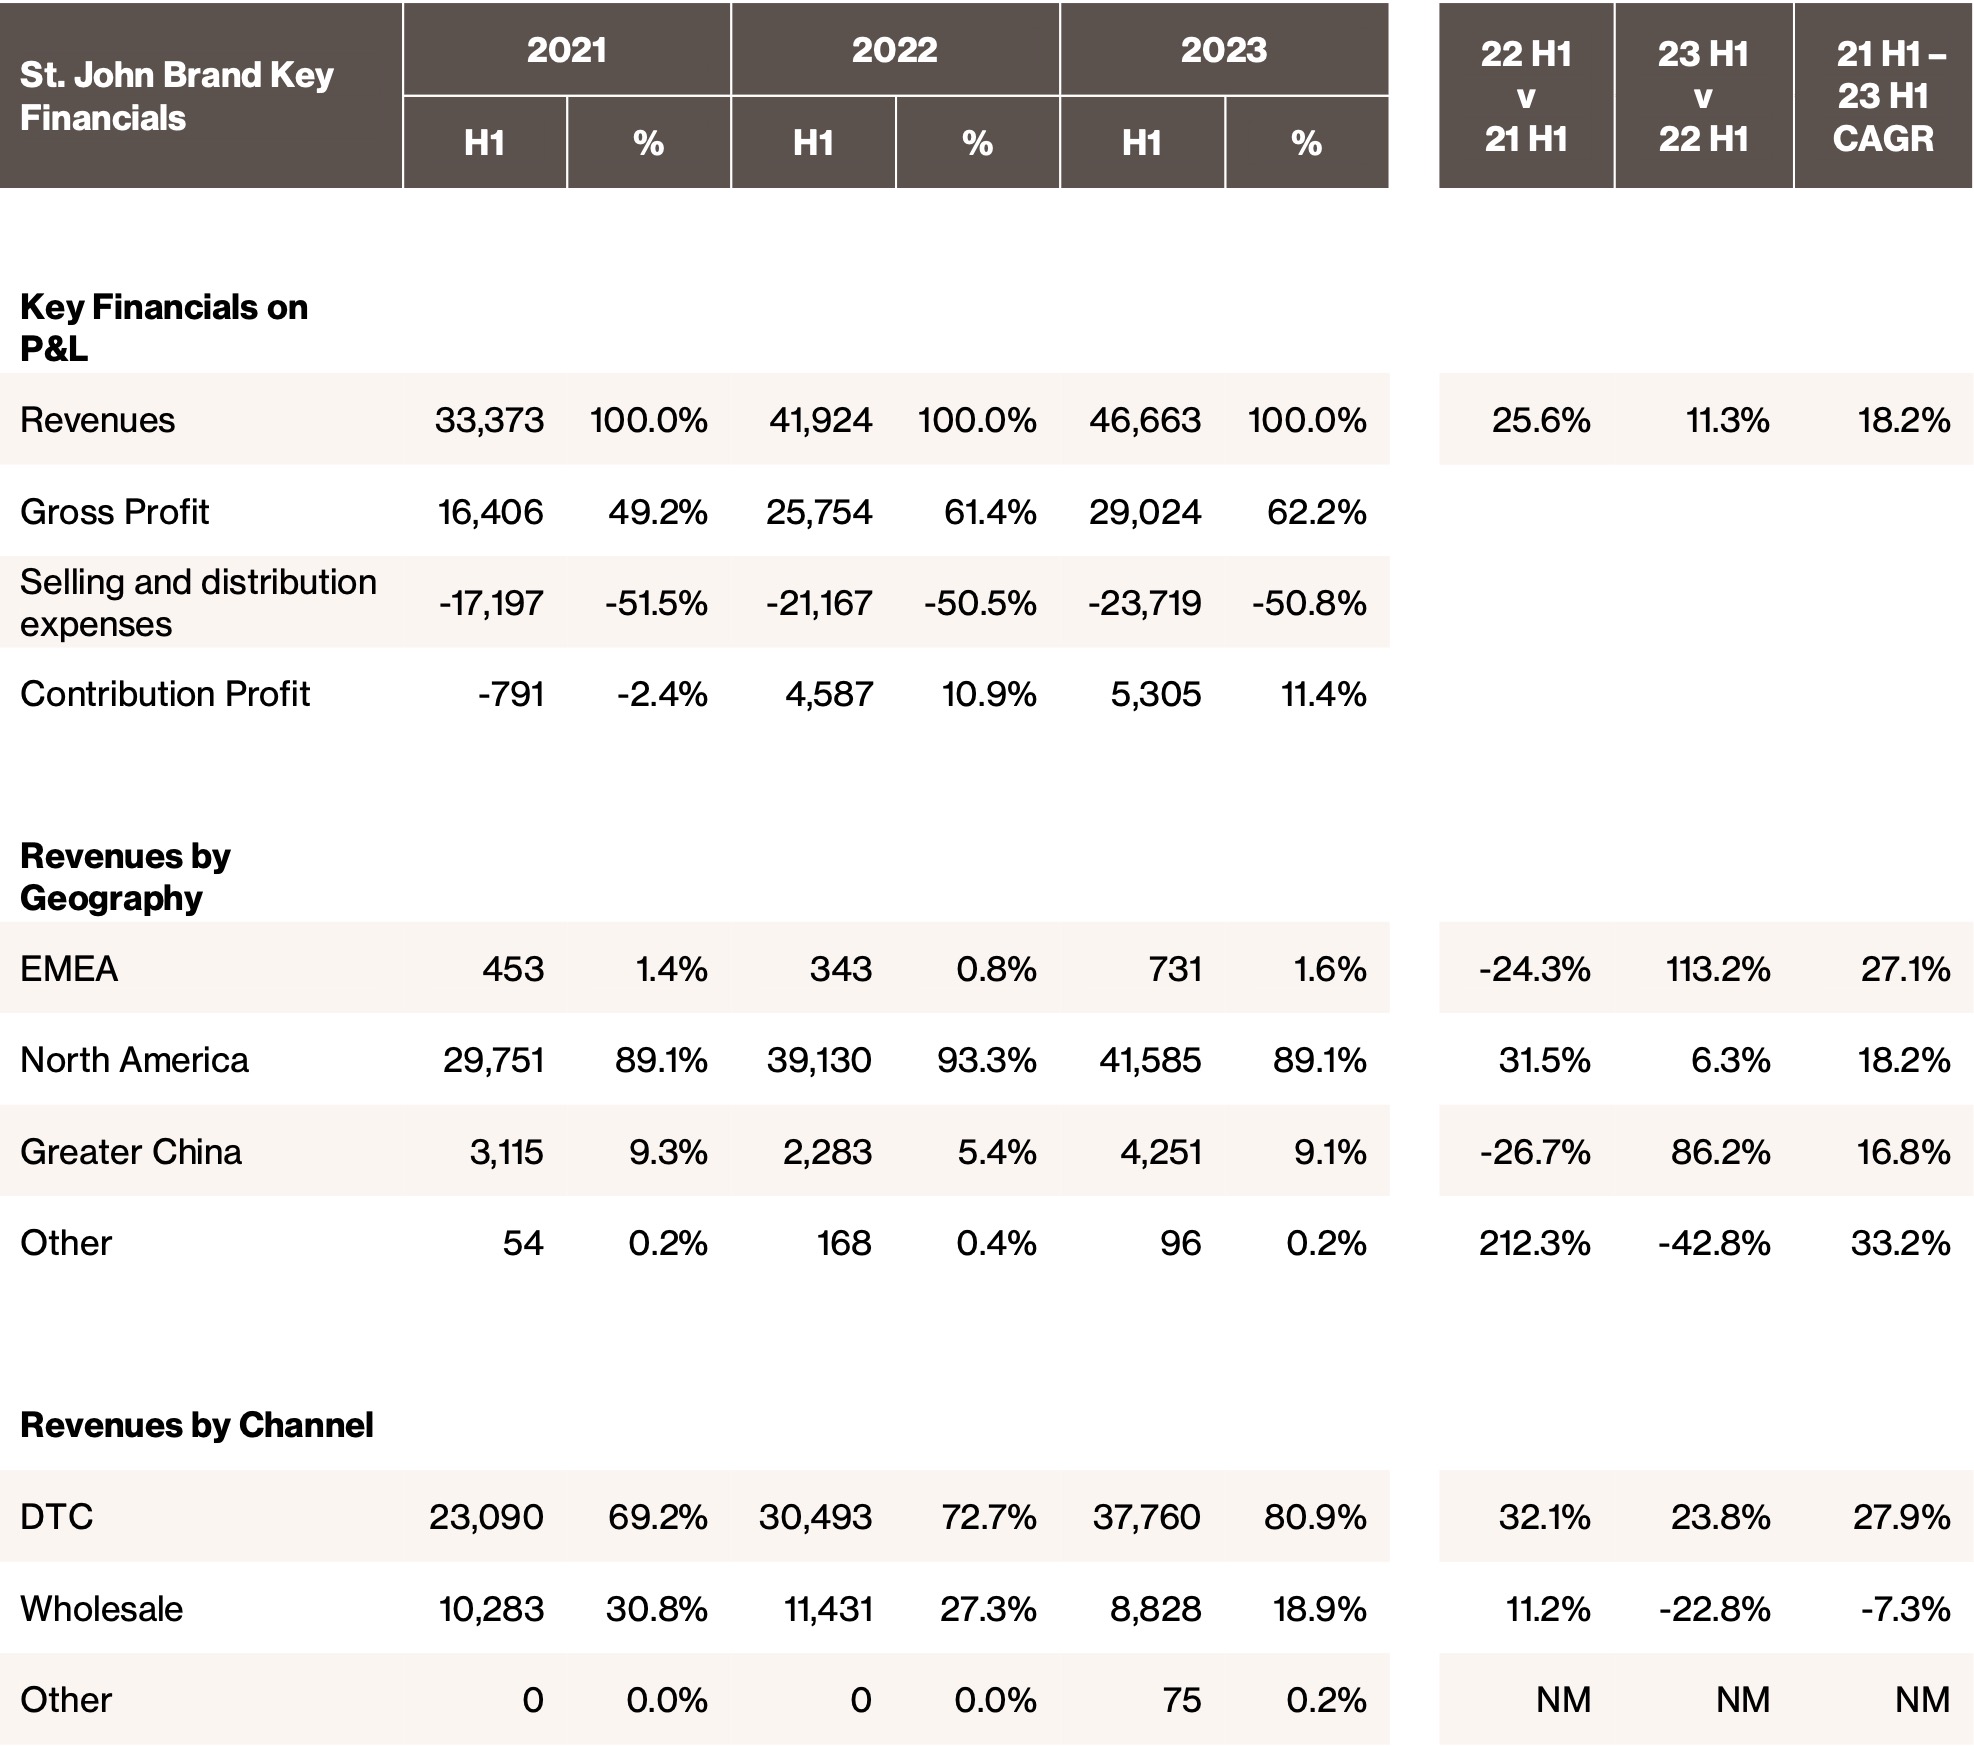
St. John: Revenue grew from €42 million in H1 2022 to €47 million in H1 2023, a growth of 11.3%. Gross profit tracked with revenue and improved from €26 million to €29 million; with gross profit margin increasing from 61.4% to 62.2%. Contribution profit was also higher by approximately €718,000, and contribution profit margin increased by 50bps. The Foundation collection launched last fall, comprised of a wardrobe’s building blocks, continued to be a key growth driver, especially with celebrity stylist Karla Welch joining as its Creative Consultant. A #OwnYourPower campaign featuring Shonda Rhimes was also successfully introduced to celebrate St. John’s customer community of incredible women doing extraordinary things.
Opex rationalization is on track and will be completed in the second half, including upgrading the supply chain. The transition from a manufacturing business to a brand company has brought stability to the brand, and it is positioned to accelerate growth and further expand its margin by focusing on marketing efforts.
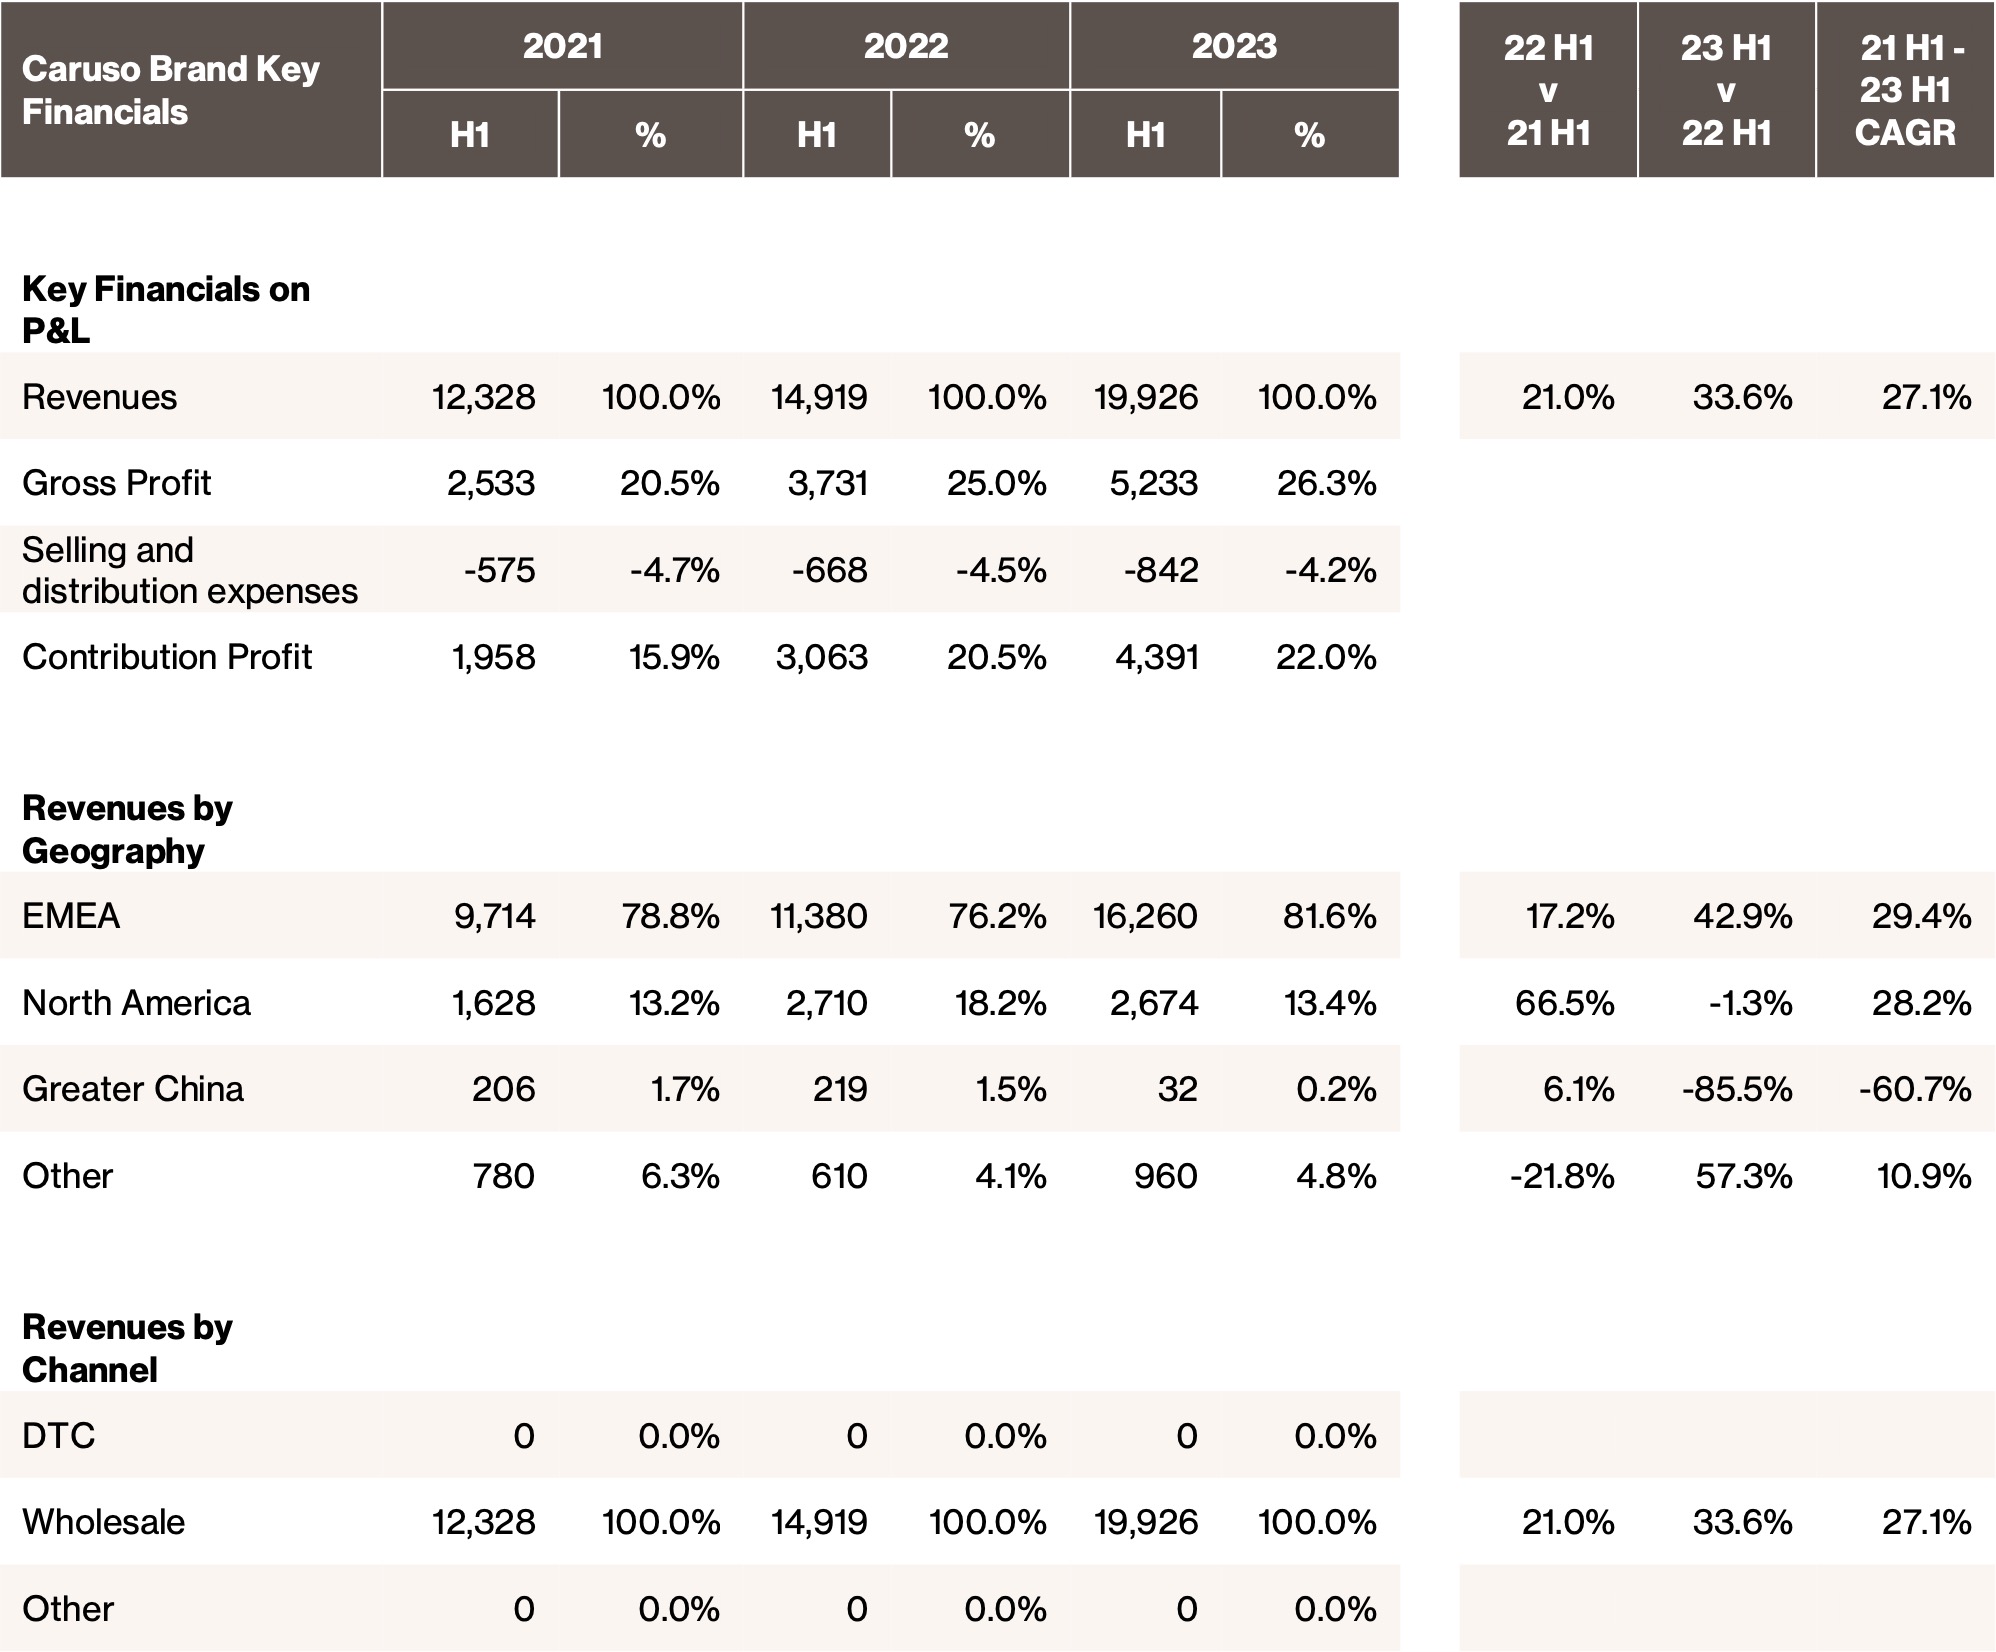
Caruso: Caruso grew its revenue by 33.6% from €15 million in H1 2022 to €20 million in H1 2023, driven by both a strong like-for-like growth of its B2B Maisons manufacturing business as well as a strong response to its branded Caruso collection. Gross profit increased from €4 million to €5 million, and gross profit margin increased from 25.0% to 26.3%. Contribution profit also increased from €3 million to €4 million, and contribution profit margin increased from 20.5% to 22.0%. Caruso continued to leverage higher sales from new accounts and deeper penetration with current customers to increase its profitability through economies of scale.
2023 Full-Year Outlook
The Group expects to maintain momentum into the second half of 2023 and continue its margin improvement. With exciting marketing initiatives, design collaborations, and collection launches planned, the Group anticipates a strong second half.
The Group continues to focus on topline revenue, and with its store network rationalized and operating expenses stabilized, the Group expects to drive its operating leverage to achieve breakeven Adjusted EBITDA in 2024.
———————————-
Note: All % changes are calculated on an actual currency exchange rate basis.
Note: This communication includes certain non-IFRS financial measures such as Contribution Profit, Contribution Profit Margin, adjusted earnings before interest and taxes (“Adjusted EBIT”), and adjusted earnings before interest, taxes, depreciation and amortization (“Adjusted EBITDA”). Please see Use of Non-IFRS Financial Metrics and Non-IFRS Financial Measures and Definition.
(1) Contribution Profit defined as Gross Profit less Selling and Marketing Expenses
***
Semi-Annual Report
Our semi-annual report, including the interim condensed consolidated financial statements as of and for the six months ended June 30, 2023, can be downloaded from the Company’s investor relations website (ir.lanvin-group.com) under the section Financials / SEC Filings, or from the SEC’s website (www.sec.gov).
***
Conference Call
As previously announced, today at 8:00AM EST/8:00PM CST/2:00PM CET, Lanvin Group will host a conference call to discuss its results for the first half of 2023 and provide an outlook for the remainder of the year. Management will refer to a slide presentation during the call, which will be made available on the day of the call. To view the presentation, please visit the “Events” tab of the Group’s investor relations website at https://ir.lanvin-group.com. To participant in the conference call, please dial into the following numbers:
United States Toll Free: 1-888-346-8982
International: 1-412-902-4272
Mainland China Toll Free: 4001-201203
Hong Kong Toll Free: 800-905945
Hong Kong Local Toll: 852-301-84992
Singapore Toll Free: 800-120-6157
A replay of the conference call will be accessible approximately one hour after the live call until September 6, 2023, by dialing the following numbers:
US Toll Free: 1-877-344-7529
International Toll: 1-412-317-0088
Canada Toll Free: 855-669-9658
Replay Access Code: 5791065
A recorded webcast of the conference call and a slide presentation will also be available on the Group’s investor relations website at https://ir.lanvin-group.com.
– END –
About Lanvin Group
Lanvin Group is a leading global luxury fashion group headquartered in Shanghai, China, managing iconic brands worldwide including Lanvin, Wolford, Sergio Rossi, St. John Knits, and Caruso. Harnessing the power of its unique strategic alliance of industry-leading partners in the luxury fashion sector, Lanvin Group strives to expand the global footprint of its portfolio brands and achieve sustainable growth through strategic investment and extensive operational know-how, combined with an intimate understanding and unparalleled access to the fastest-growing luxury fashion markets in the world. Lanvin Group is listed on the New York Stock Exchange under the ticker symbol ‘LANV’. For more information about Lanvin Group, please visit www.lanvin-group.com, and to view our investor presentation, please visit https://ir.lanvin-group.com.
***
Forward-Looking Statements
This communication, including the section “2023 Full-Year Outlook”, contains “forward-looking statements” within the meaning of the “safe harbor” provisions of the Private Securities Litigation Reform Act of 1995. Forward-looking statements generally are accompanied by words such as “believe,” “may,” “will,” “estimate,” “continue,” “anticipate,” “intend,” “expect,” “should,” “would,” “plan,” “predict,” “potential,” “seem,” “seek,” “future,” “outlook,” “project” and similar expressions that predict or indicate future events or trends or that are not statements of historical matters. These forward-looking statements include, but are not limited to, statements regarding estimates and forecasts of other financial and performance metrics and projections of market opportunity. These statements are based on various assumptions, whether or not identified in this communication, and on the current expectations of the respective management of Lanvin Group and are not predictions of actual performance. These forward-looking statements are provided for illustrative purposes only and must not be relied on by an investor as, a guarantee, an assurance, a prediction or a definitive statement of fact or probability. Actual events and circumstances are difficult or impossible to predict and will differ from assumptions. Many actual events and circumstances are beyond the control of Lanvin Group. Potential risks and uncertainties that could cause the actual results to differ materially from those expressed or implied by forward-looking statements include, but are not limited to, changes adversely affecting the business in which Lanvin Group is engaged; Lanvin Group’s projected financial information, anticipated growth rate, profitability and market opportunity may not be an indication of its actual results or future results; management of growth; the impact of COVID-19 or similar public health crises on Lanvin Group’s business; Lanvin Group’s ability to safeguard the value, recognition and reputation of its brands and to identify and respond to new and changing customer preferences; the ability and desire of consumers to shop; Lanvin Group’s ability to successfully implement its business strategies and plans; Lanvin Group’s ability to effectively manage its advertising and marketing expenses and achieve desired impact; its ability to accurately forecast consumer demand; high levels of competition in the personal luxury products market; disruptions to Lanvin Group’s distribution facilities or its distribution partners; Lanvin Group’s ability to negotiate, maintain or renew its license agreements; Lanvin Group’s ability to protect its intellectual property rights; Lanvin Group’s ability to attract and retain qualified employees and preserve craftmanship skills; Lanvin Group’s ability to develop and maintain effective internal controls; general economic conditions; the result of future financing efforts; and those factors discussed in the reports filed by Lanvin Group from time to time with the SEC. If any of these risks materialize or Lanvin Group’s assumptions prove incorrect, actual results could differ materially from the results implied by these forward-looking statements. There may be additional risks that Lanvin Group presently does not know, or that Lanvin Group currently believes are immaterial, that could also cause actual results to differ from those contained in the forward-looking statements. In addition, forward-looking statements reflect Lanvin Group’s expectations, plans, or forecasts of future events and views as of the date of this communication. Lanvin Group anticipates that subsequent events and developments will cause Lanvin Group’s assessments to change. However, while Lanvin Group may elect to update these forward-looking statements at some point in the future, Lanvin Group specifically disclaim any obligation to do so. These forward-looking statements should not be relied upon as representing Lanvin Group’s assessments of any date subsequent to the date of this communication. Accordingly, reliance should not be placed upon the forward-looking statements.
***
Use of Non-IFRS Financial Metrics
This communication includes certain non-IFRS financial measures such as Contribution Profit, Contribution Profit Margin, adjusted operating profit, adjusted earnings before interest and taxes (“Adjusted EBIT”), and adjusted earnings before interest, taxes, depreciation and amortization (“Adjusted EBITDA”). These non-IFRS measures are an addition, and not a substitute for or superior to measures of financial performance prepared in accordance with IFRS and should not be considered as an alternative to net income, operating income or any other performance measures derived in accordance with IFRS. Reconciliations of non-IFRS measures to their most directly comparable IFRS counterparts are included in the Appendix to this communication. Lanvin Group believes that these non-IFRS measures of financial results provide useful supplemental information to investors about Lanvin Group. Lanvin Group believes that the use of these non-IFRS financial measures provides an additional tool for investors to use in evaluating projected operating results and trends in and in comparing Lanvin Group’s financial measures with other similar companies, many of which present similar non-IFRS financial measures to investors. However, there are a number of limitations related to the use of these non-IFRS measures and their nearest IFRS equivalents. For example, other companies may calculate non-IFRS measures differently, or may use other measures to calculate their financial performance, and therefore Lanvin Group’s non-IFRS measures may not be directly comparable to similarly titled measures of other companies. Lanvin Group does not consider these non-IFRS measures in isolation or as an alternative to financial measures determined in accordance with IFRS. The principal limitation of these non-IFRS financial measures is that they exclude significant expenses, income and tax liabilities that are required by IFRS to be recorded in Lanvin Group’s financial statements. In addition, they are subject to inherent limitations as they reflect the exercise of judgements by Lanvin Group about which expense and income are excluded or included in determining these non-IFRS financial measures. In order to compensate for these limitations, Lanvin Group presents non-IFRS financial measures in connection with IFRS results.
***
Enquiries:
Media
Lanvin Group
Miya He
miya.he@lanvin-group.com
Investors
Lanvin Group
James Kim
james.kim@lanvin-group.com
Appendix
Lanvin Group Consolidated Income Statement
(€ in Thousands, unless otherwise noted)
Lanvin Group Consolidated Balance Sheet
(€ in Thousands, unless otherwise noted)
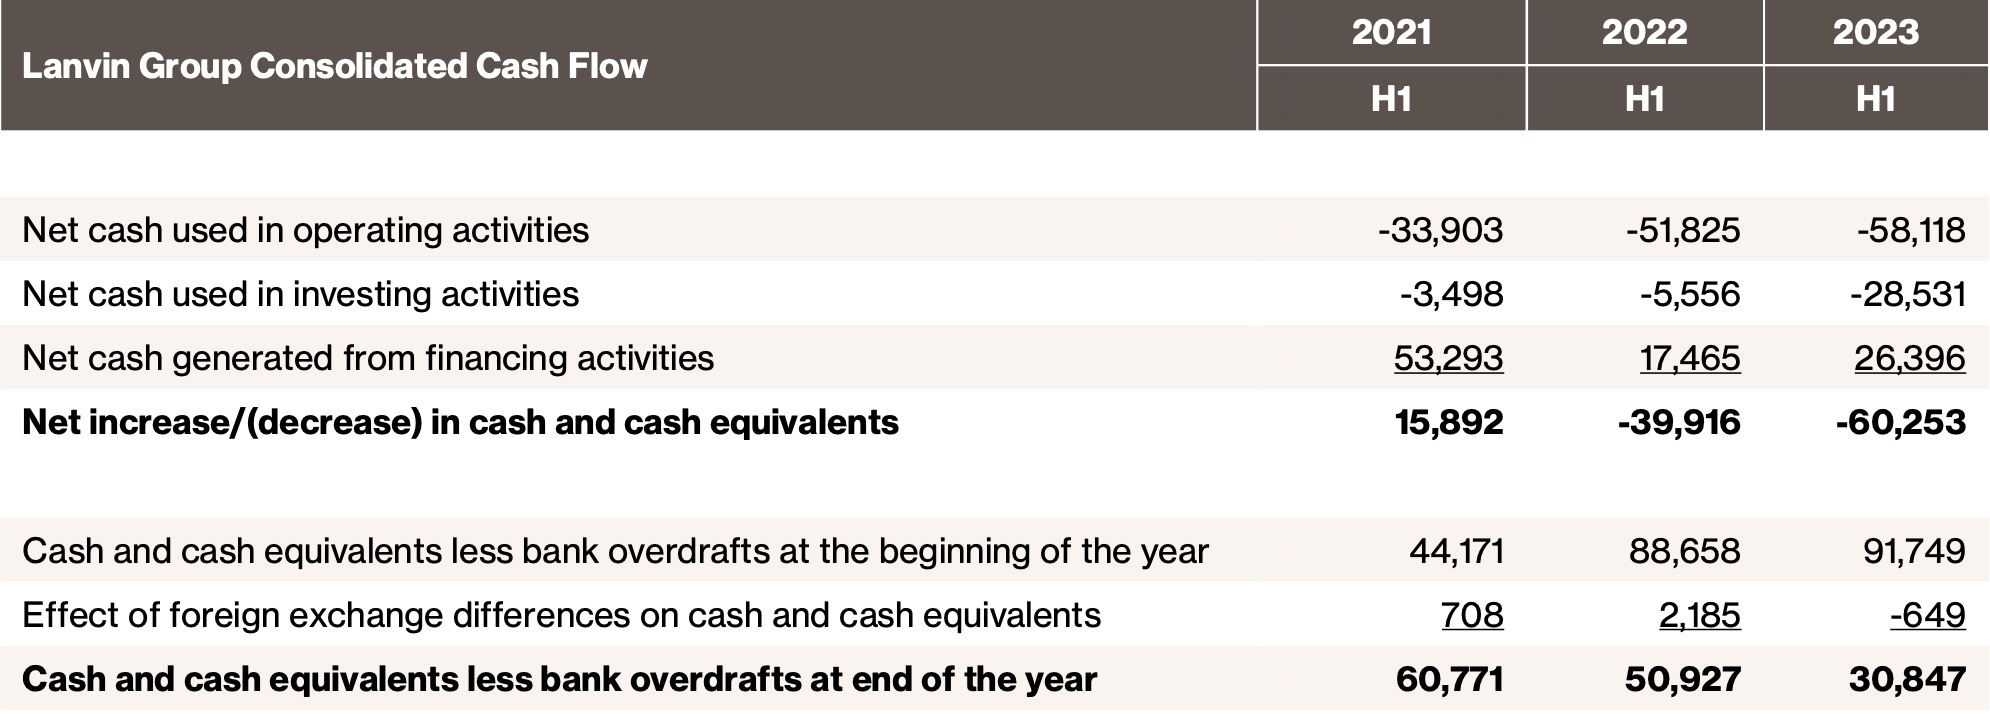
Lanvin Group Consolidated Cash Flow
(€ in Thousands, unless otherwise noted)
Lanvin Brand Key Financials(3)
(€ in thousands, unless otherwise noted)
Wolford Brand Key Financials(3)
(€ in thousands, unless otherwise noted)
Sergio Rossi Brand Key Financials(3)
(€ in thousands, unless otherwise noted)
St. John Brand Key Financials(3)
(€ in thousands, unless otherwise noted)
Caruso Brand Key Financials(3)
(€ in thousands, unless otherwise noted)
Lanvin Group Brand Footprint
Non-IFRS Financial Measures Reconciliation
(€ in Thousands, unless otherwise noted)
———————————-
Note:
(1) These are Non-IFRS Financial Measures and will be mentioned throughout this communication. Please see Non-IFRS Financial Measures and Definition.
(2) The amount less than Euro1,000 is indicated with “*”.
(3) Brand-level results are presented exclusive of eliminations. There is a certain discrepancy due to rounding when the numbers are added.
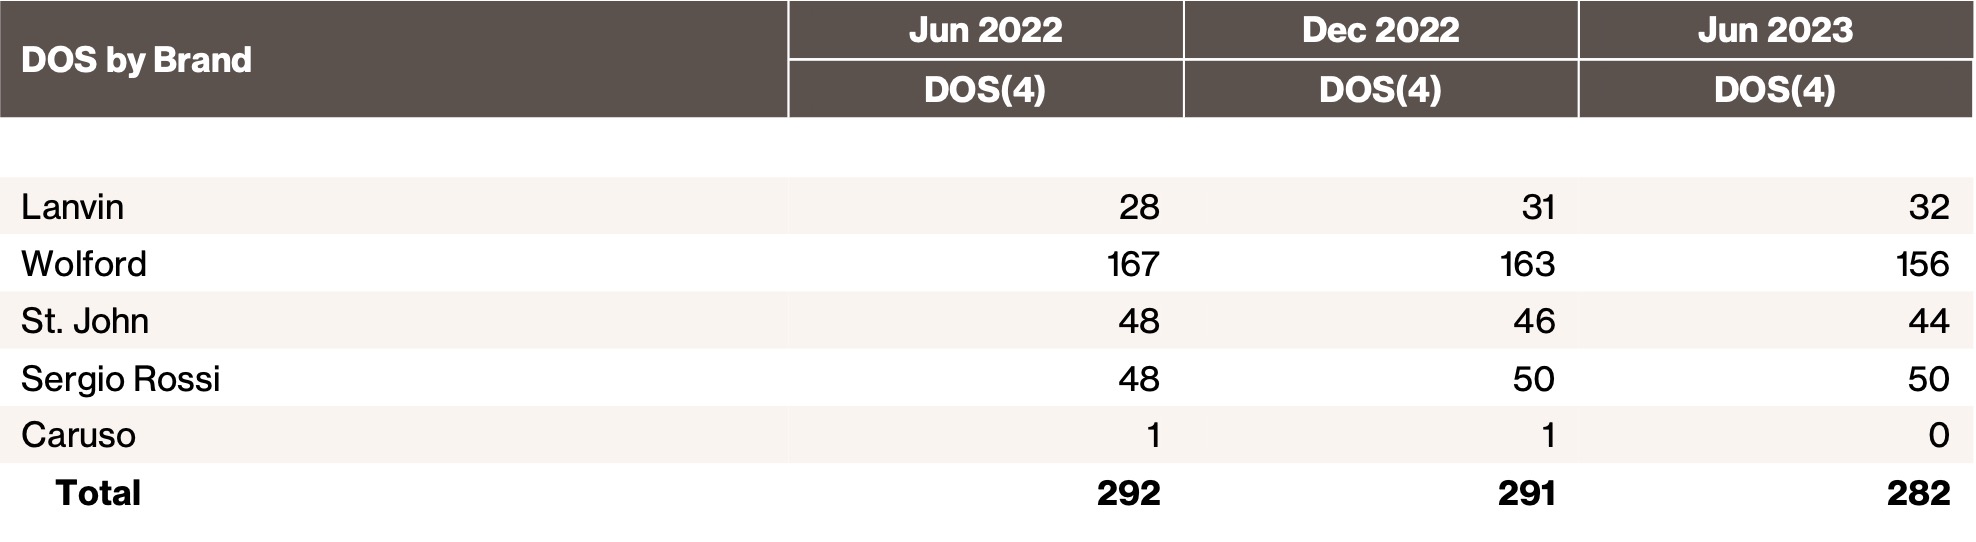
(4) DOS refers to Directly Operated Stores which include boutiques, outlets, concession shop-in-shops and pop-up stores.
Non-IFRS Financial Measures and Definitions
Management monitors and evaluates operating and financial performance using several non-IFRS financial measures including: Contribution Profit, Contribution Profit Margin, Adjusted EBIT and Adjusted EBITDA. Management believes that these non-IFRS financial measures provide useful and relevant information regarding our performance and improve our ability to assess financial performance and financial position. They also provide comparable measures that facilitate management’s ability to identify operational trends, as well as make decisions regarding future spending, resource allocations and other operational decisions. While similar measures are widely used in the industry in which we operate, the financial measures that we use may not be comparable to other similarly named measures used by other companies nor are they intended to be substitutes for measures of financial performance or financial position as prepared in accordance with IFRS.
Contribution Profit is defined as revenue less the cost of sales and selling and marketing expenses. Contribution Profit subtracts the main variable expenses of selling and marketing expenses from Gross Profit, and our management believes this measure is an important indicator of profitability at the marginal level. Below contribution profit, the main expenses are general administrative expenses and other operating expenses (which include foreign exchange gains or losses and impairment losses). As we continue to improve the management of our portfolio brands, we believe we can achieve greater economy of scale across the different brands by maintaining the fixed expenses at a lower level as a proportion of revenue. We therefore use Contribution Profit Margin as a key indicator of profitability at the group level as well as the portfolio brand level.
Contribution Profit Margin is defined as Contribution Profit divided by revenue.
Adjusted Operating Profit is defined as Contribution Profit margin less General and administrative expenses.
Adjusted EBIT is defined as profit or loss before income taxes, net finance cost, share based compensation, adjusted for income and costs which are significant in nature and that management considers not reflective of underlying operational activities, mainly including net gains on disposal of long-term assets, negative goodwill from acquisition of Sergio Rossi, gain on debt restructuring and government grants.
Adjusted EBITDA is defined as profit or loss before income taxes, net finance cost, exchange gains/(losses), depreciation, amortization, share based compensation and provisions and impairment losses adjusted for income and costs which are significant in nature and that management considers not reflective of underlying operational activities, mainly including net gains on disposal of long-term assets, negative goodwill from acquisition of Sergio Rossi, gain on debt restructuring and government grants.