Lanvin Group Shows Resiliency in Sales and On-Track Margin Improvement in 2023

Revenue Continues Year-over-Year Growth Trend
- Revenue of €426 million for FY2023, a 1% increase over FY2022 despite macroeconomic headwinds
- Continued margin improvement with Group gross profit margin increasing to 59% and both contribution profit(1) and adjusted EBITDA margins steadily improving
- Resilient performance of the brands through challenging market environment; Lanvin brand showed improving trend in the second half of the year while overall industry faced strong headwinds
- Steady regional performance highlighted by nearly 8% growth in APAC
- Improving store metrics with steady DTC revenue on a lower base of stores showed footprint rationalization strategy on track; first Middle East Lanvin location opened in Riyadh with two more anticipated in the coming months
- On track for cashflow breakeven in 2025 with Caruso achieving breakeven Adjusted EBITDA in 2023 and two additional brands expected to achieve Adjusted EBITDA breakeven in 2024
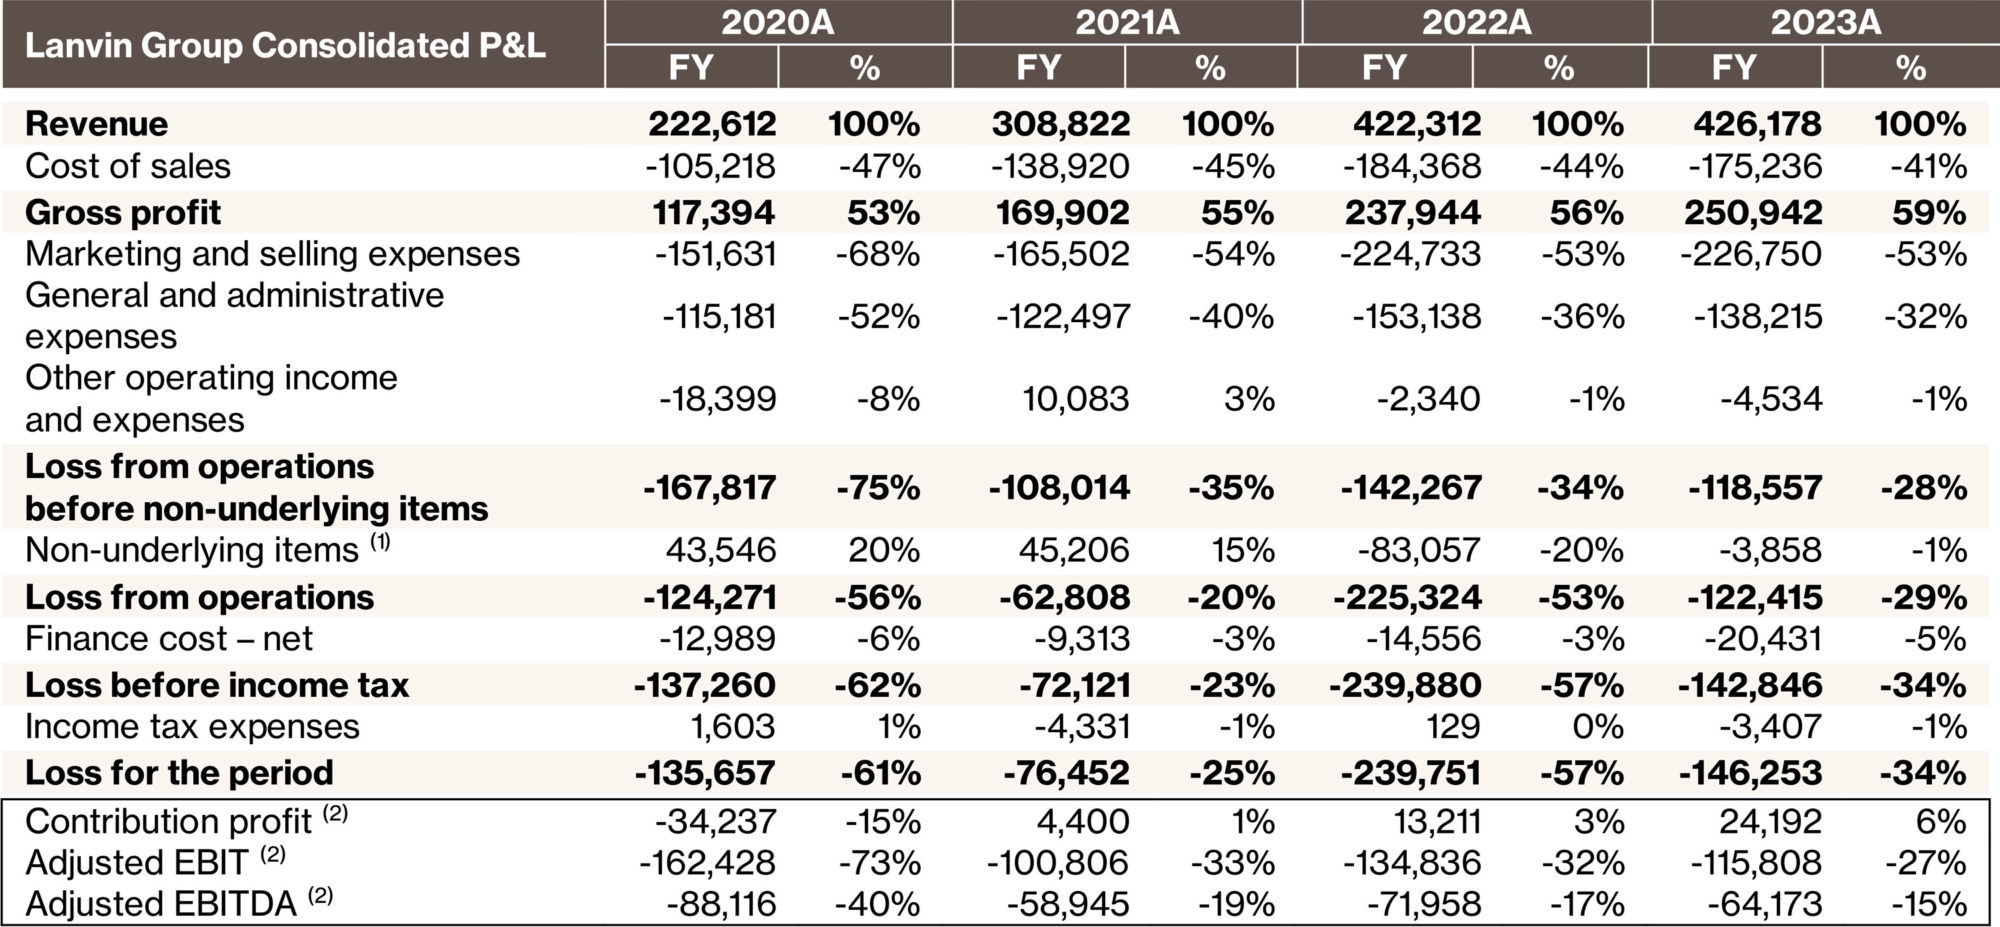
April 30, 2024 – Lanvin Group (NYSE: LANV, the “Group”), a global luxury fashion group with Lanvin, Wolford, Sergio Rossi, St. John and Caruso in its portfolio of brands, today announced its results for the full-year 2023. The Group achieved revenue of €426 million, a 1% increase year-over-year versus 2022; and gross profit of €251 million, representing a 59% gross margin and a 250bps increase versus 2022.
Zhen Huang, Chairman of Lanvin Group, said: “I’m honored to have become the Chairman of Lanvin Group in 2023. The Group has made significant progress since its inception in 2018. In reviewing our 2023, I thought back to the resiliency we showed during the pandemic, posting growth every year, and I see the same resilience and our ability to thrive in any environment, this past year. I believe we are on the right track and am optimistic we will reach our growth and profitability goals.”
Eric Chan, CEO of Lanvin Group, said: “Managers drive companies, and their teams drive results. I am thoroughly impressed by the efforts of our managers and our teams to maintain growth and continue to forge the path to profitability in a challenging market environment. My team, along with our brand managers remain resolute in our mission to grow our brands and drive profitability.
We are a group of brands with a provenance and heritage second-to-none, and I am proud of what we have accomplished in 2023. We are collectively on a journey, and I am very optimistic about our future.”
Review of the Full-Year 2023 Results
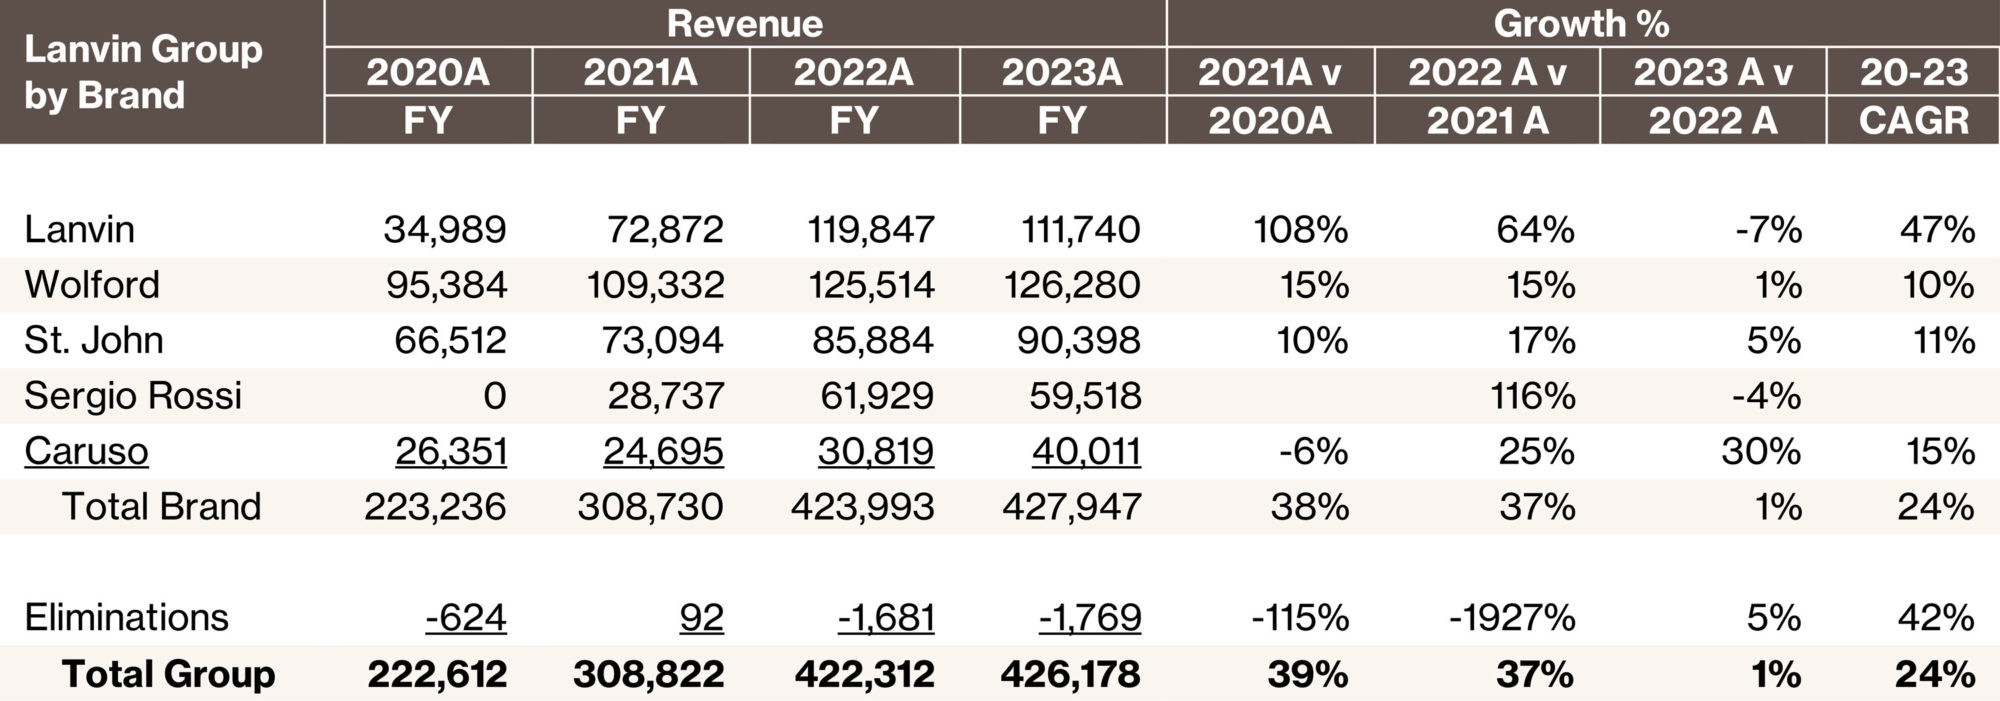
Lanvin Group Revenue by Segment
(€ in Thousands, unless otherwise noted)
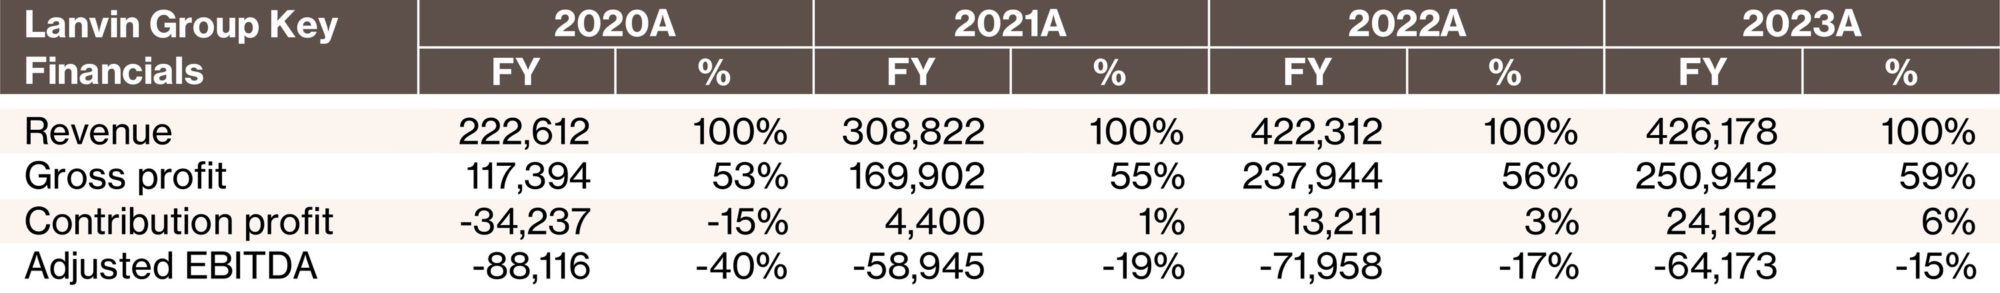
Lanvin Group Key Financials
(€ in Thousands, unless otherwise noted)
Selected Highlights
Maintained growth trend: In the face of growing headwinds for the industry, the Group maintained growth with a 1% improvement over the prior year. All brands showed resiliency and maintained steady revenue in EMEA and North America and highlighted by nearly 8% growth in APAC. E-Commerce continued to thrive with 3% growth, while overall DTC and Wholesale channels stayed flat. E-Commerce sales in the US, in particular, saw growth by leveraging the group’s US digital platform.
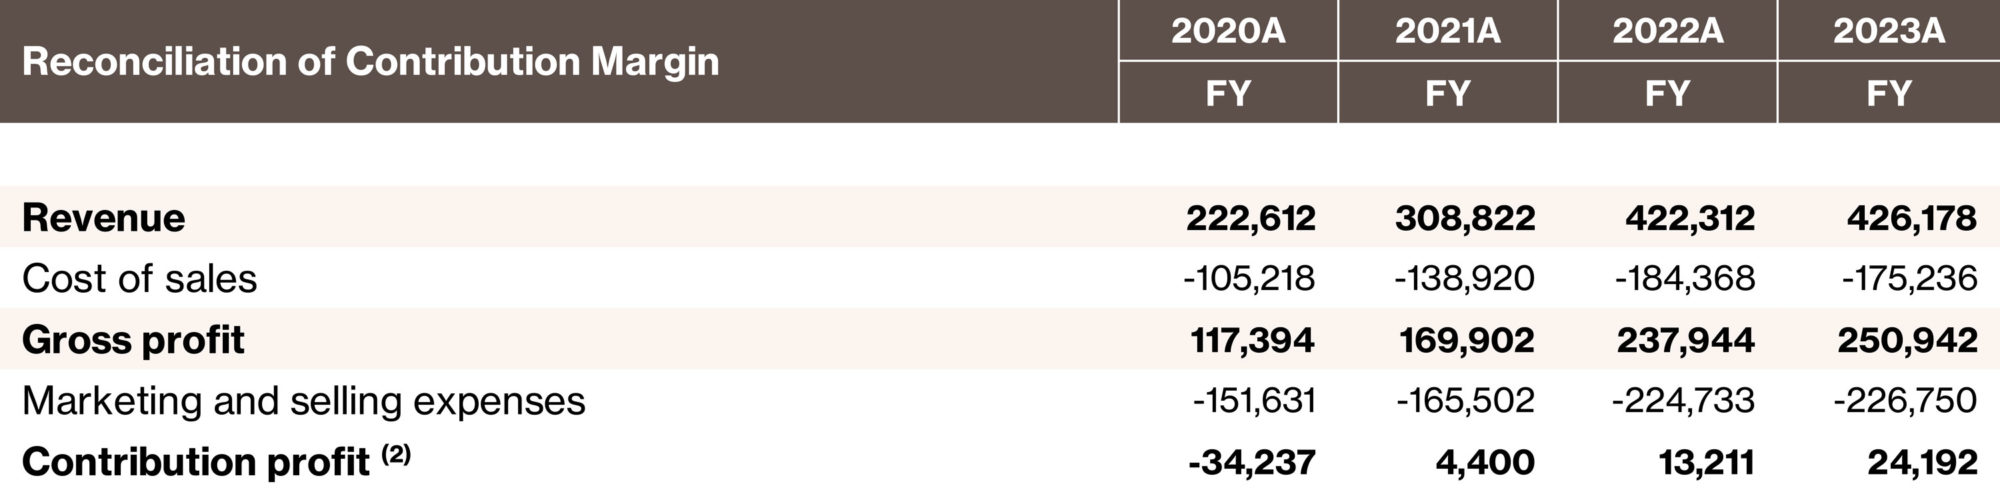
Continued positive progress with margin profile: Margins at all levels, gross profit, contribution profit, and Adjusted EBITDA saw improvement in 2023. Gross margin increased to 59% from 56%, contribution profit margin improved to 6% from 3%, and Adjusted EBITDA as a percentage of sales improved by 198bps from 2022.
Refocused brand and product strategies showing results: One of the main drivers of growth in 2023 was the refocus of brand strategies and optimization of product categories and mix. New product lines and categories, collaborations, and a focus on accessories all impacted the growth and margins. Lanvin brand went through a creative transition in 2023, further cementing the vision for the future of the Group to harness each brand’s legacy and utilize its archives as we evolve our product categories and offerings.
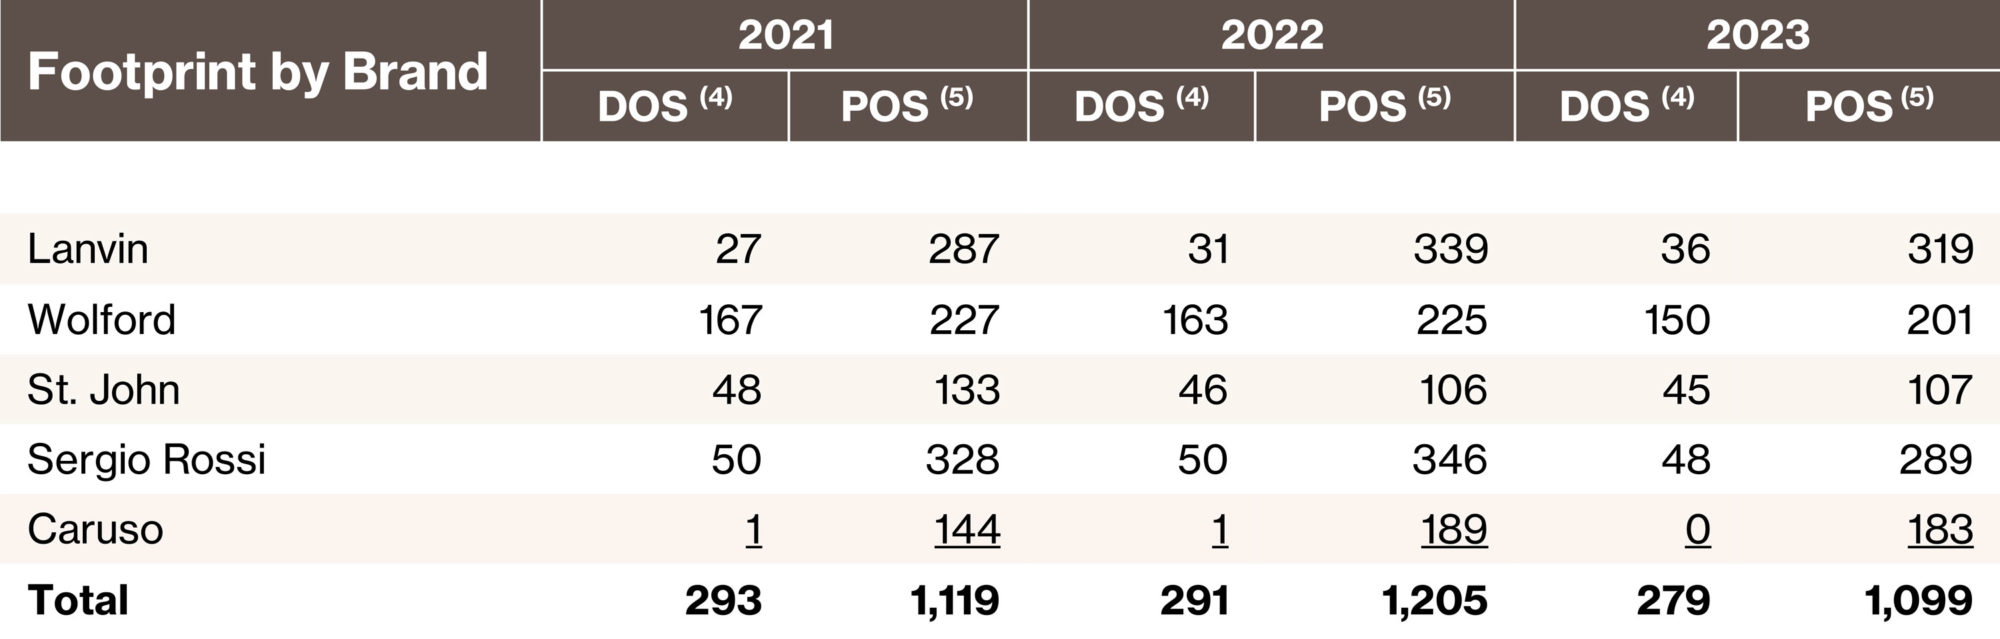
Significant progress optimizing store network: The Group continued to cull its footprint with the closure of 36 stores while successfully launching 24 new retail doors, systemwide. Improved store strategies implemented in 2023 provided better unit economics, with the Group’s DTC revenue remaining steady despite an overall reduction of retail doors. Improved store metrics from strategic changes implemented starting in 2022 have paved the way for Lanvin to grow its base significantly with five, net new locations and its first in the Middle East in Riyadh.
Discussion of FY2023 Financials
Revenue
For FY2023, the Group generated revenue of €426 million, a 1% increase year-over-year. The DTC and Wholesale channels were slightly down, but e-Commerce sales (a part of the DTC channel) grew by 3%. Other revenue, which includes royalty income rose significantly, benefiting from the reacquisition of Lanvin’s Japanese trademarks in March 2023. The Group maintained its growth trend with a compound annual growth rate of 24% since 2020. Full details of the Group’s revenue can be found in our Annual Report on Form 20-F for the year ended December 31, 2023.
Gross Profit
Gross profit increased to €251 million, representing a 59% margin versus €238 million in 2022 at a margin of 56%. The improvement in gross profit margin was driven by increasing accessories as a proportion of sales, and continued emphasis on higher-margin DTC revenue as a proportion of total sales. Additionally, refining the product offerings helped improve inventory management, with more core products with higher sell-through rates.
Contribution Profit (1)
The Group uses a measure, internally, called contribution profit, defined as gross profit less selling & marketing expenses to gauge the variable profitability performance and analyze the improvements at our brands. Contribution profit for the year was €24 million, representing a 6% margin and an improvement of €11 million from 2022. The contribution profit is more than five times higher than in 2021, the first year of positive contribution profit. The Group continues to show steady progress in managing its operating expenses and increasing margins.
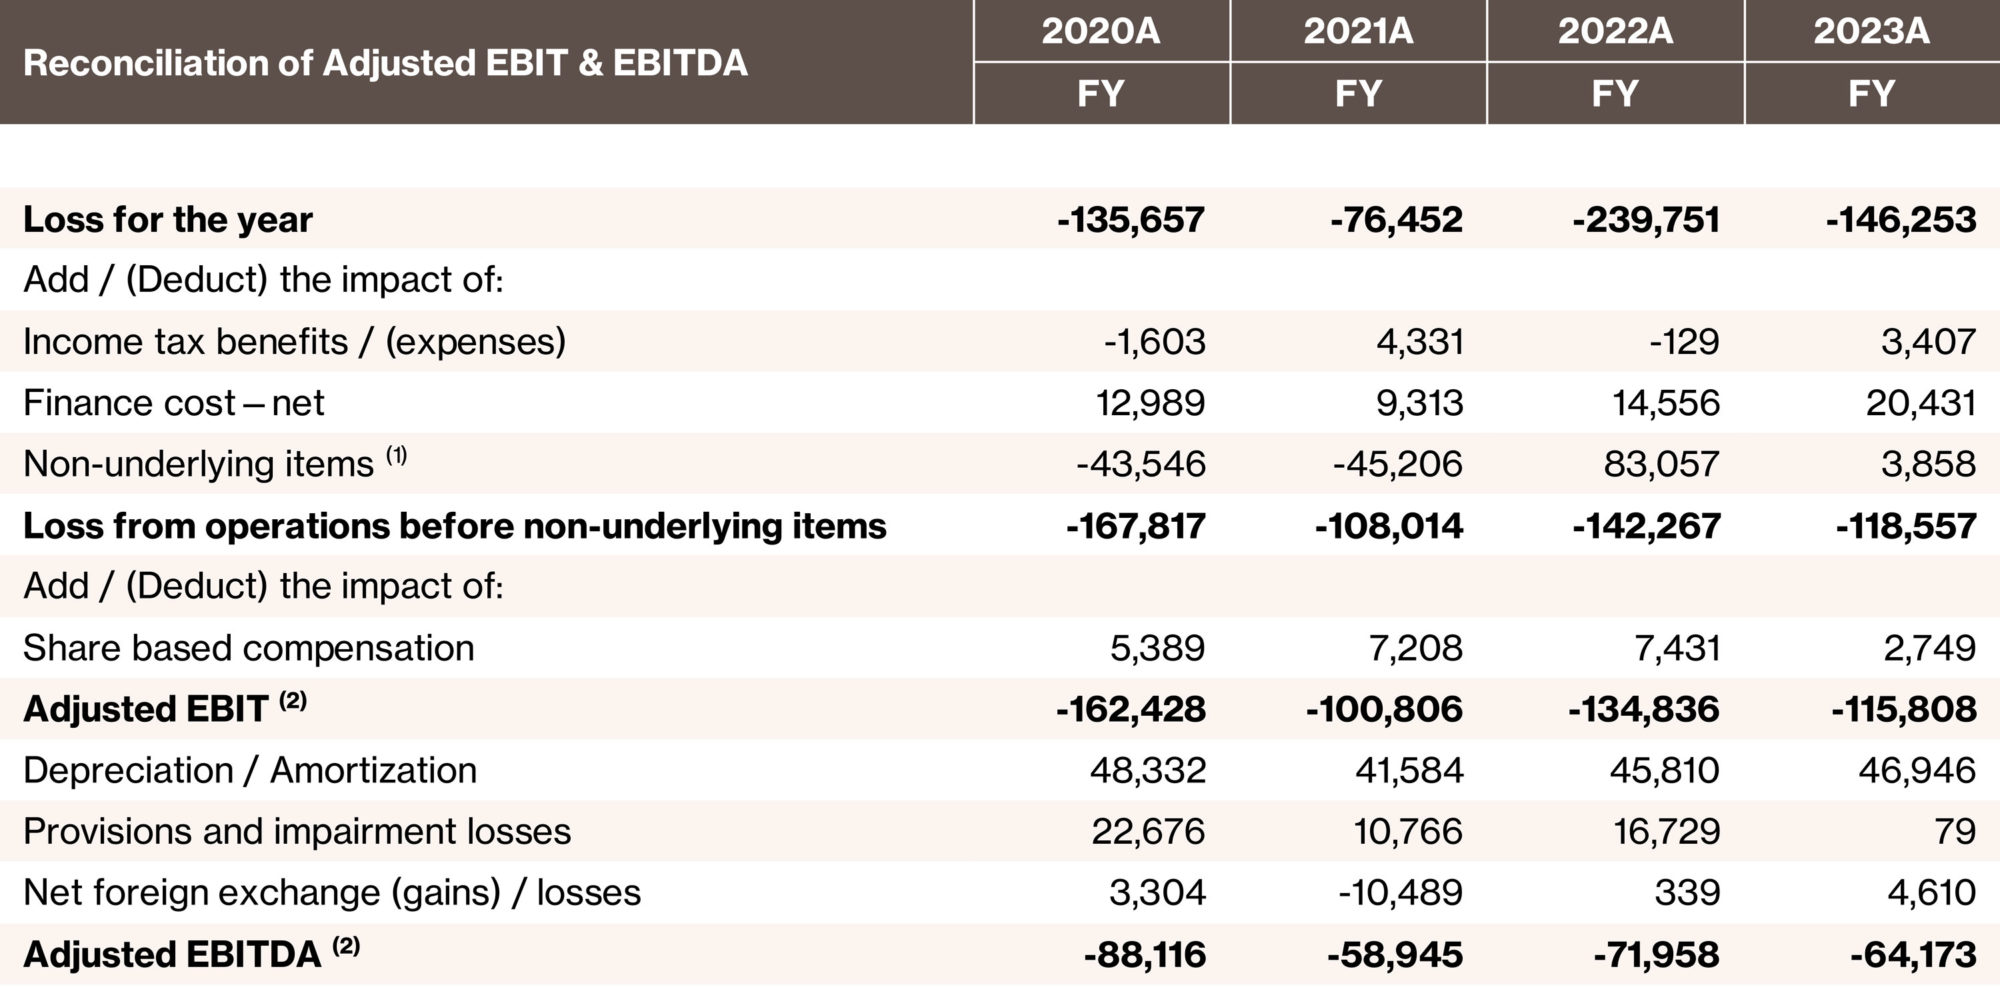
Adjusted EBITDA
Adjusted EBITDA remained at loss for 2023, but as a percentage of sales, continued to improve going from (19%) in 2021 to (17%) in 2022 and (15%) in 2023.
Results by Segment
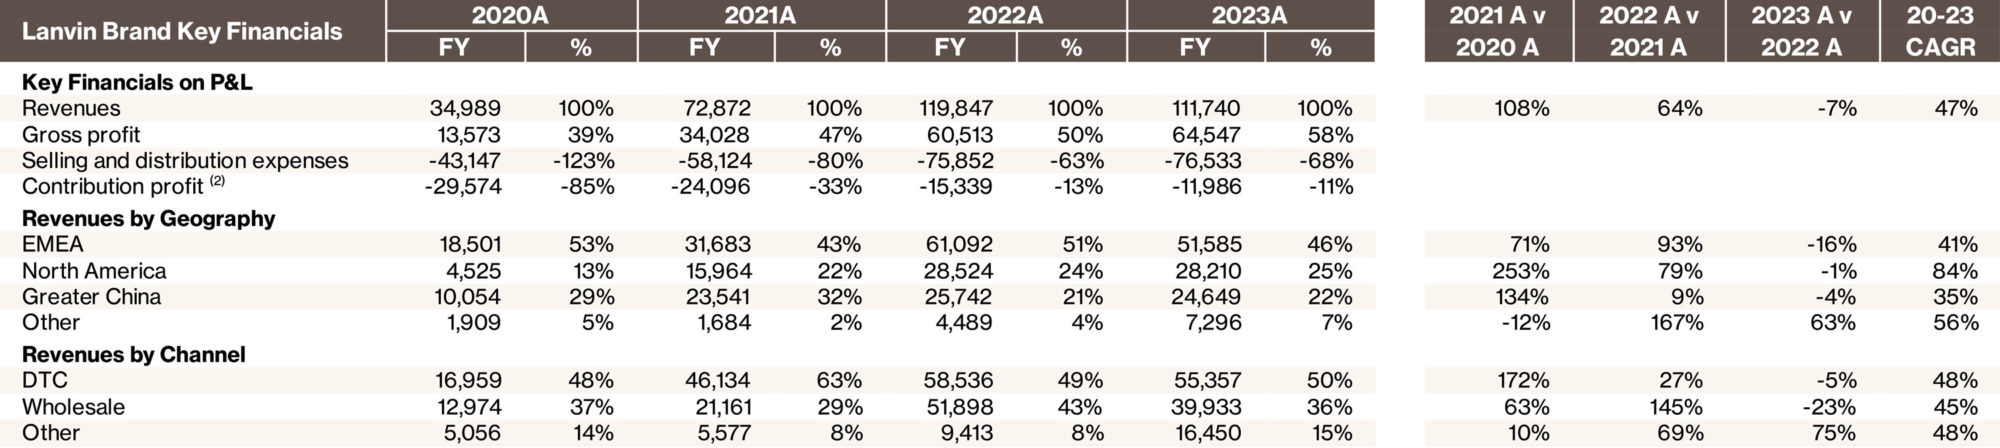
Lanvin: Revenue was down, but the brand improved the trend in the second half of 2023, improving from a 11% decrease in the first half to land at a decrease of 7% for the full year with revenue of €112 million. Gross profit increased to €65 million, at a margin of 58%, from €61 million, at a margin of 50%, in 2022. Gross profit improved from higher full-price sell-through, an increase in the balance of accessories versus ready-to-where sales, a further shift to higher-margin boutique sales, and better inventory management. Contribution profit continued to improve going from a contribution loss of €15 million in 2022 to a contribution loss of €12 million in 2023 with the percentage of sales improving year-over-year from negative 13% to negative 11%.
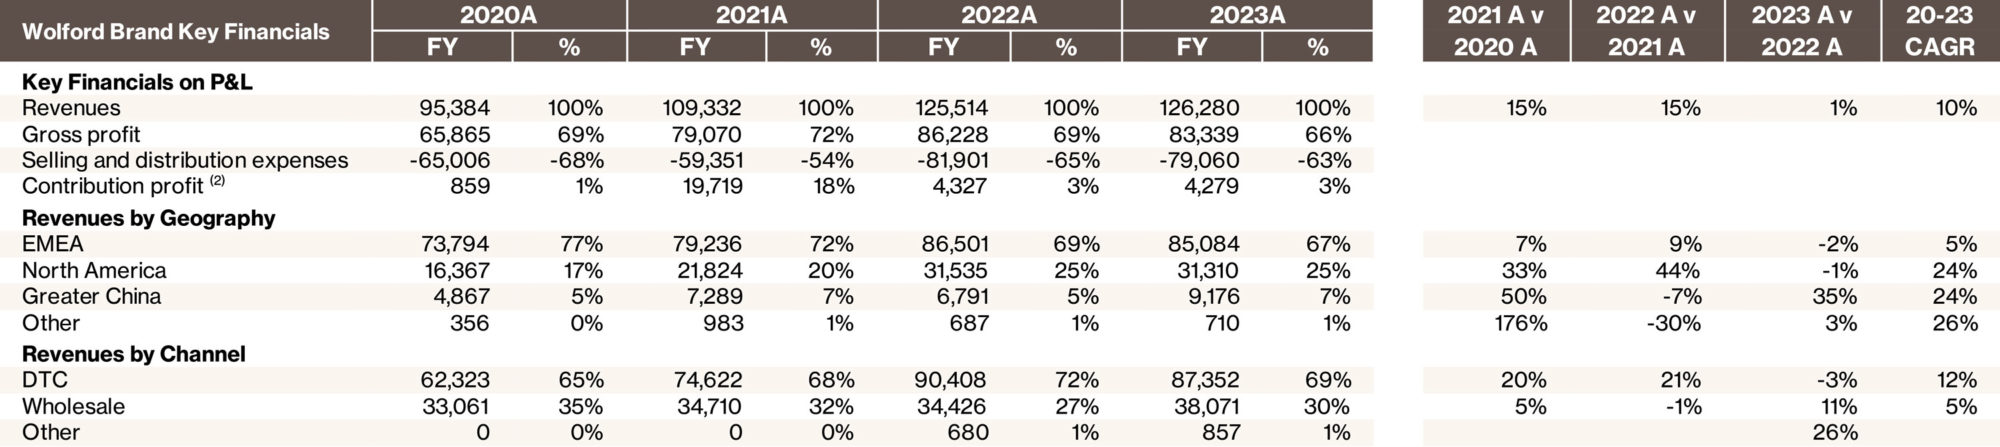
Wolford: Revenue grew slightly by 1%. Gross profit decreased to €83 million from €86 million, in 2022, and margin declined from 69% to 66% due to a reclassification of expenses. Contribution profit remained steady at €4 million in 2023 at a margin of 3%.
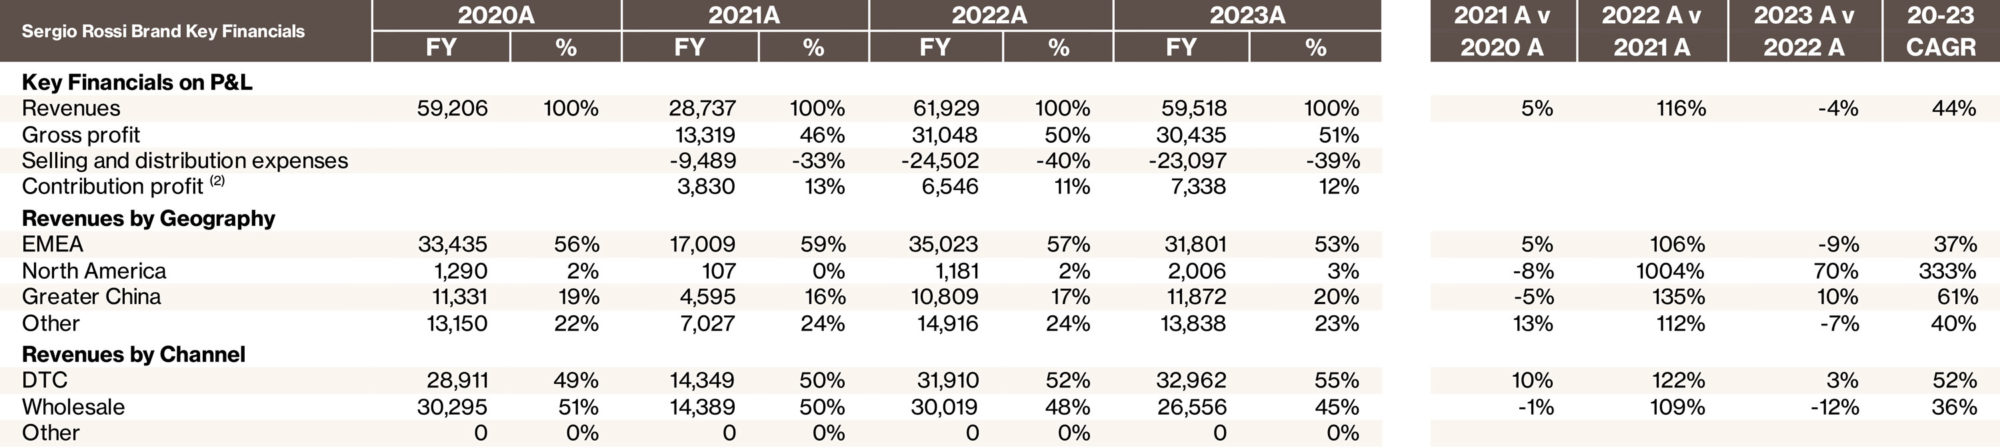
Sergio Rossi: Revenue was down by 4% decreasing from €62 million in 2022, to €60 million. Gross profit margin increased from 50% to 51% in 2023. Gross profit margin improved from an increased proportion of higher-margin DTC sales. Contribution profit margin improved in 2023, from 11% to 12% from better management of selling and distribution costs.
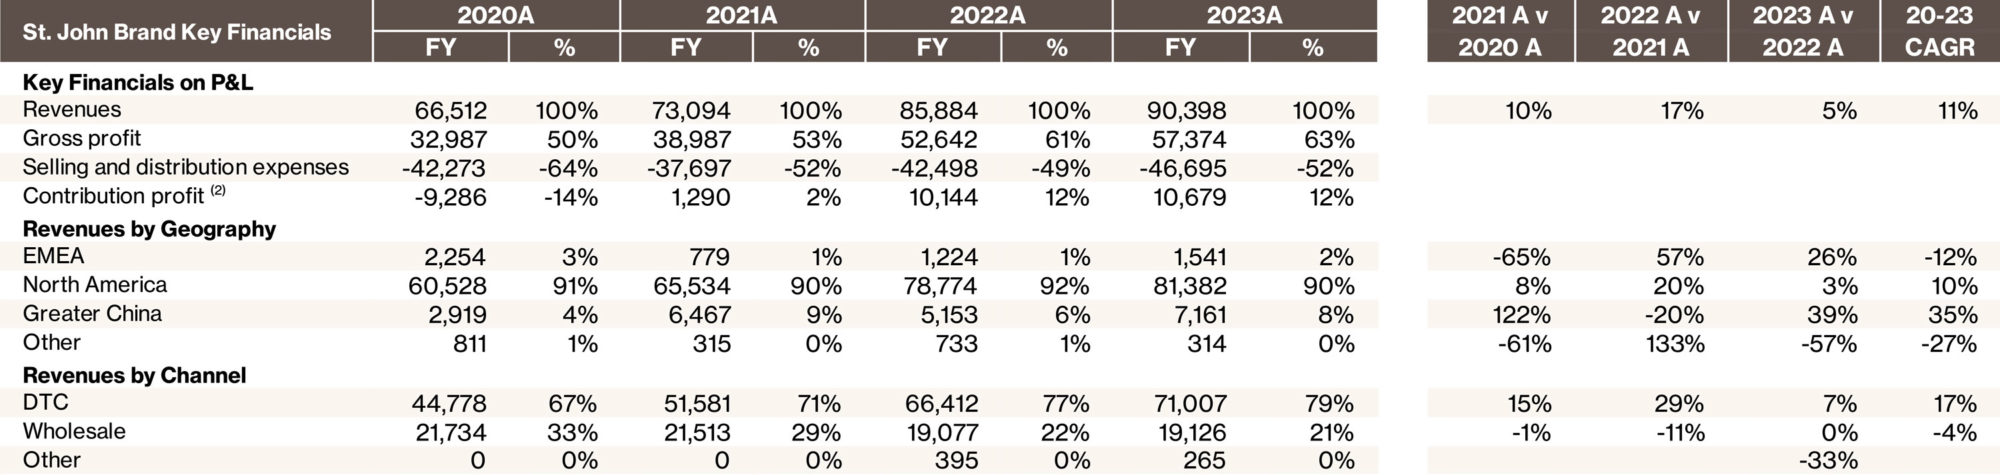
St. John: Revenue increased by 5%, from €86 million to €90 million. St. John’s margin profile continued to improve with gross profit growing from €53 million to €57 million in 2023; with margin increasing from 61% to 63%. St. John implemented a new wholesale model, which improved its gross margin. Contribution profit also increased from €10 million to €11 million; margin remained steady at 12% with some of the wholesale expense reduction that helped improve gross margin being reclassified as selling expense.
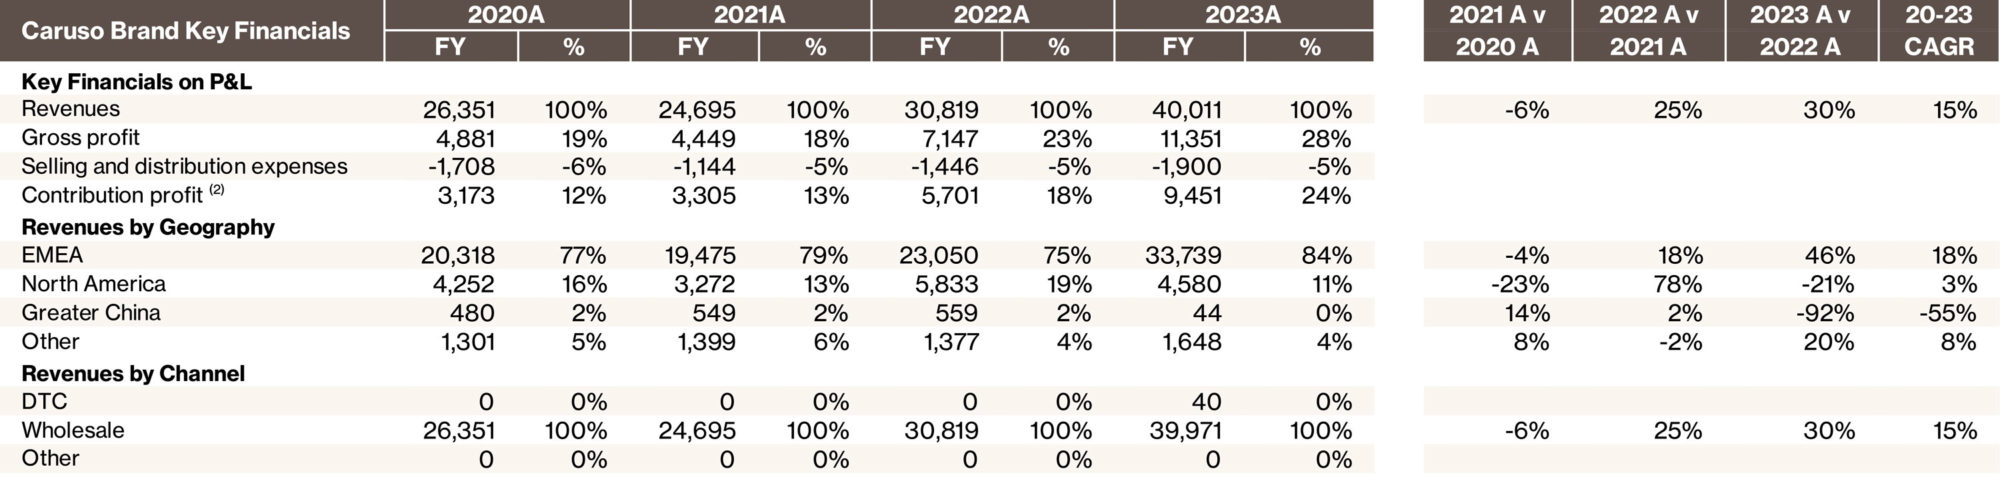
Caruso: Revenue increased significantly by 30% going from €31 million to €40 million in 2023. Growth came from an expansion of production capacity and additions to its specialized workforce. Caruso continued its strong, steady performance with its gross profit increasing from €7 million to €11 million in 2023, and margin increasing from 23% to 28%. Contribution profit also increased from €6 million to €9 million, and contribution profit margin increased markedly from 18% to 24%. Profitability improved by streamlining production and higher sell-through of its proprietary Caruso brand products. Caruso achieved breakeven Adjusted EBITDA for the year.
2024 Outlook
The macroeconomy remains uncertain, but regions like North America remain steady, and regions like the Middle East present significant growth opportunities for Lanvin Group’s brands.
The Group plans to approach the market tactically to capture growth opportunities and market share. With one brand Adjusted EBITDA breakeven in 2023 and two additional brands expected to be in 2024, the Group is making significant progress in its path to profitability; and with much of the legwork of streamlining the organization completed, the Group sees scale expansion as a key driver of profitability, for 2024 and beyond.
The Group is built upon a collaborative eco-system and continues to work with their strategic partners to build the platform. As such, one of the Group’s focuses in 2024 will be the continued development of its eco-system with additional strategic partners that will facilitate regional growth, improve logistics and expand product categories.
———————————-
Note: All % changes are calculated on an actual currency exchange rate basis.
Note: This communication includes certain non-IFRS financial measures such as contribution profit, contribution margin, adjusted earnings before interest and taxes (“Adjusted EBIT”), and adjusted earnings before interest, taxes, depreciation and amortization (“Adjusted EBITDA”). Please see Non-IFRS Financial Measures and Definition.
(1) Contribution profit defined as gross profit less Selling and Marketing Expenses
***
Annual Report on Form 20-F
Our annual report on Form 20-F, including the consolidated financial statements for the fiscal year ended December 31, 2023, can be downloaded from the Company’s investor relations website (ir.lanvin-group.com) under the section Financials / SEC Filings, or from the SEC’s website (www.sec.gov).
***
Conference Call
As previously announced, today at 8:00AM EST/8:00PM CST/2:00PM CET, Lanvin Group will host a conference call to discuss its results for the full-year 2023 and provide an outlook for 2024. Management will refer to a slide presentation during the call, which will be made available on the day of the call. To view the presentation, please visit the “Events” tab of the Group’s investor relations website at https://ir.lanvin-group.com. To participant in the conference call, please register by clicking on the following link: https://dpregister.com/sreg/10188721/fc6969ad02
A replay of the conference call will be accessible approximately one hour after the live call until May 6, 2024, by dialing the following numbers:
US Toll Free: 1-877-344-7529
International Toll: 1-412-317-0088
Canada Toll Free: 855-669-9658
Replay Access Code: 1551559
A recorded webcast of the conference call and a slide presentation will also be available on the Group’s investor relations website at https://ir.lanvin-group.com.
***
Next Scheduled Announcement
The next scheduled announcement will be the H1 2024 earnings results release in August 2024. To receive email alerts of the timing of future financial news releases, as well as future announcements, please register at https://ir.lanvin-group.com.
***
About Lanvin Group
Lanvin Group is a leading global luxury fashion group headquartered in Shanghai, China, managing iconic brands worldwide including Lanvin, Wolford, Sergio Rossi, St. John Knits, and Caruso. Harnessing the power of its unique strategic alliance of industry-leading partners in the luxury fashion sector, Lanvin Group strives to expand the global footprint of its portfolio brands and achieve sustainable growth through strategic investment and extensive operational know-how, combined with an intimate understanding and unparalleled access to the fastest-growing luxury fashion markets in the world. Lanvin Group is listed on the New York Stock Exchange under the ticker symbol ‘LANV’. For more information about Lanvin Group, please visit www.lanvin-group.com, and to view our investor presentation, please visit https://ir.lanvin-group.com.
***
Forward-Looking Statements
This communication, including the section “2024 Outlook”, contains “forward-looking statements” within the meaning of the “safe harbor” provisions of the Private Securities Litigation Reform Act of 1995. Forward-looking statements generally are accompanied by words such as “believe,” “may,” “will,” “estimate,” “continue,” “anticipate,” “intend,” “expect,” “should,” “would,” “plan,” “predict,” “potential,” “seem,” “seek,” “future,” “outlook,” “project” and similar expressions that predict or indicate future events or trends or that are not statements of historical matters. These forward-looking statements include, but are not limited to, statements regarding estimates and forecasts of other financial and performance metrics and projections of market opportunity. These statements are based on various assumptions, whether or not identified in this communication, and on the current expectations of the respective management of Lanvin Group and are not predictions of actual performance. These forward-looking statements are provided for illustrative purposes only and must not be relied on by an investor as, a guarantee, an assurance, a prediction or a definitive statement of fact or probability. Actual events and circumstances are difficult or impossible to predict and will differ from assumptions. Many actual events and circumstances are beyond the control of Lanvin Group. Potential risks and uncertainties that could cause the actual results to differ materially from those expressed or implied by forward-looking statements include, but are not limited to, changes adversely affecting the business in which Lanvin Group is engaged; Lanvin Group’s projected financial information, anticipated growth rate, profitability and market opportunity may not be an indication of its actual results or future results; management of growth; the impact of COVID-19 or similar public health crises on Lanvin Group’s business; Lanvin Group’s ability to safeguard the value, recognition and reputation of its brands and to identify and respond to new and changing customer preferences; the ability and desire of consumers to shop; Lanvin Group’s ability to successfully implement its business strategies and plans; Lanvin Group’s ability to effectively manage its advertising and marketing expenses and achieve desired impact; its ability to accurately forecast consumer demand; high levels of competition in the personal luxury products market; disruptions to Lanvin Group’s distribution facilities or its distribution partners; Lanvin Group’s ability to negotiate, maintain or renew its license agreements; Lanvin Group’s ability to protect its intellectual property rights; Lanvin Group’s ability to attract and retain qualified employees and preserve craftmanship skills; Lanvin Group’s ability to develop and maintain effective internal controls; general economic conditions; the result of future financing efforts; and those factors discussed in the reports filed by Lanvin Group from time to time with the SEC. If any of these risks materialize or Lanvin Group’s assumptions prove incorrect, actual results could differ materially from the results implied by these forward-looking statements. There may be additional risks that Lanvin Group presently does not know, or that Lanvin Group currently believes are immaterial, that could also cause actual results to differ from those contained in the forward-looking statements. In addition, forward-looking statements reflect Lanvin Group’s expectations, plans, or forecasts of future events and views as of the date of this communication. Lanvin Group anticipates that subsequent events and developments will cause Lanvin Group’s assessments to change. However, while Lanvin Group may elect to update these forward-looking statements at some point in the future, Lanvin Group specifically disclaim any obligation to do so. These forward-looking statements should not be relied upon as representing Lanvin Group’s assessments of any date subsequent to the date of this communication. Accordingly, reliance should not be placed upon the forward-looking statements.
***
Use of Non-IFRS Financial Metrics
This communication includes certain non-IFRS financial measures such as contribution profit, contribution margin, adjusted earnings before interest and taxes (“Adjusted EBIT”), and adjusted earnings before interest, taxes, depreciation and amortization (“Adjusted EBITDA”). These non-IFRS measures are an addition, and not a substitute for or superior to measures of financial performance prepared in accordance with IFRS and should not be considered as an alternative to net income, operating income or any other performance measures derived in accordance with IFRS. Reconciliations of non-IFRS measures to their most directly comparable IFRS counterparts are included in the Appendix to this communication. Lanvin Group believes that these non-IFRS measures of financial results provide useful supplemental information to investors about Lanvin Group. Lanvin Group believes that the use of these non-IFRS financial measures provides an additional tool for investors to use in evaluating projected operating results and trends in and in comparing Lanvin Group’s financial measures with other similar companies, many of which present similar non-IFRS financial measures to investors. However, there are a number of limitations related to the use of these non-IFRS measures and their nearest IFRS equivalents. For example, other companies may calculate non-IFRS measures differently, or may use other measures to calculate their financial performance, and therefore Lanvin Group’s non-IFRS measures may not be directly comparable to similarly titled measures of other companies. Lanvin Group does not consider these non-IFRS measures in isolation or as an alternative to financial measures determined in accordance with IFRS. The principal limitation of these non-IFRS financial measures is that they exclude significant expenses, income and tax liabilities that are required by IFRS to be recorded in Lanvin Group’s financial statements. In addition, they are subject to inherent limitations as they reflect the exercise of judgements by Lanvin Group about which expense and income are excluded or included in determining these non-IFRS financial measures. In order to compensate for these limitations, Lanvin Group presents non-IFRS financial measures in connection with IFRS results.
***
Enquiries:
Media
Lanvin Group
Hezhi Zhang
hezhi.zhang@lanvin-group.com
Investors
Lanvin Group
James Kim
james.kim@lanvin-group.com
Appendix
Lanvin Group Consolidated Income Statement
(€ in Thousands, unless otherwise noted)
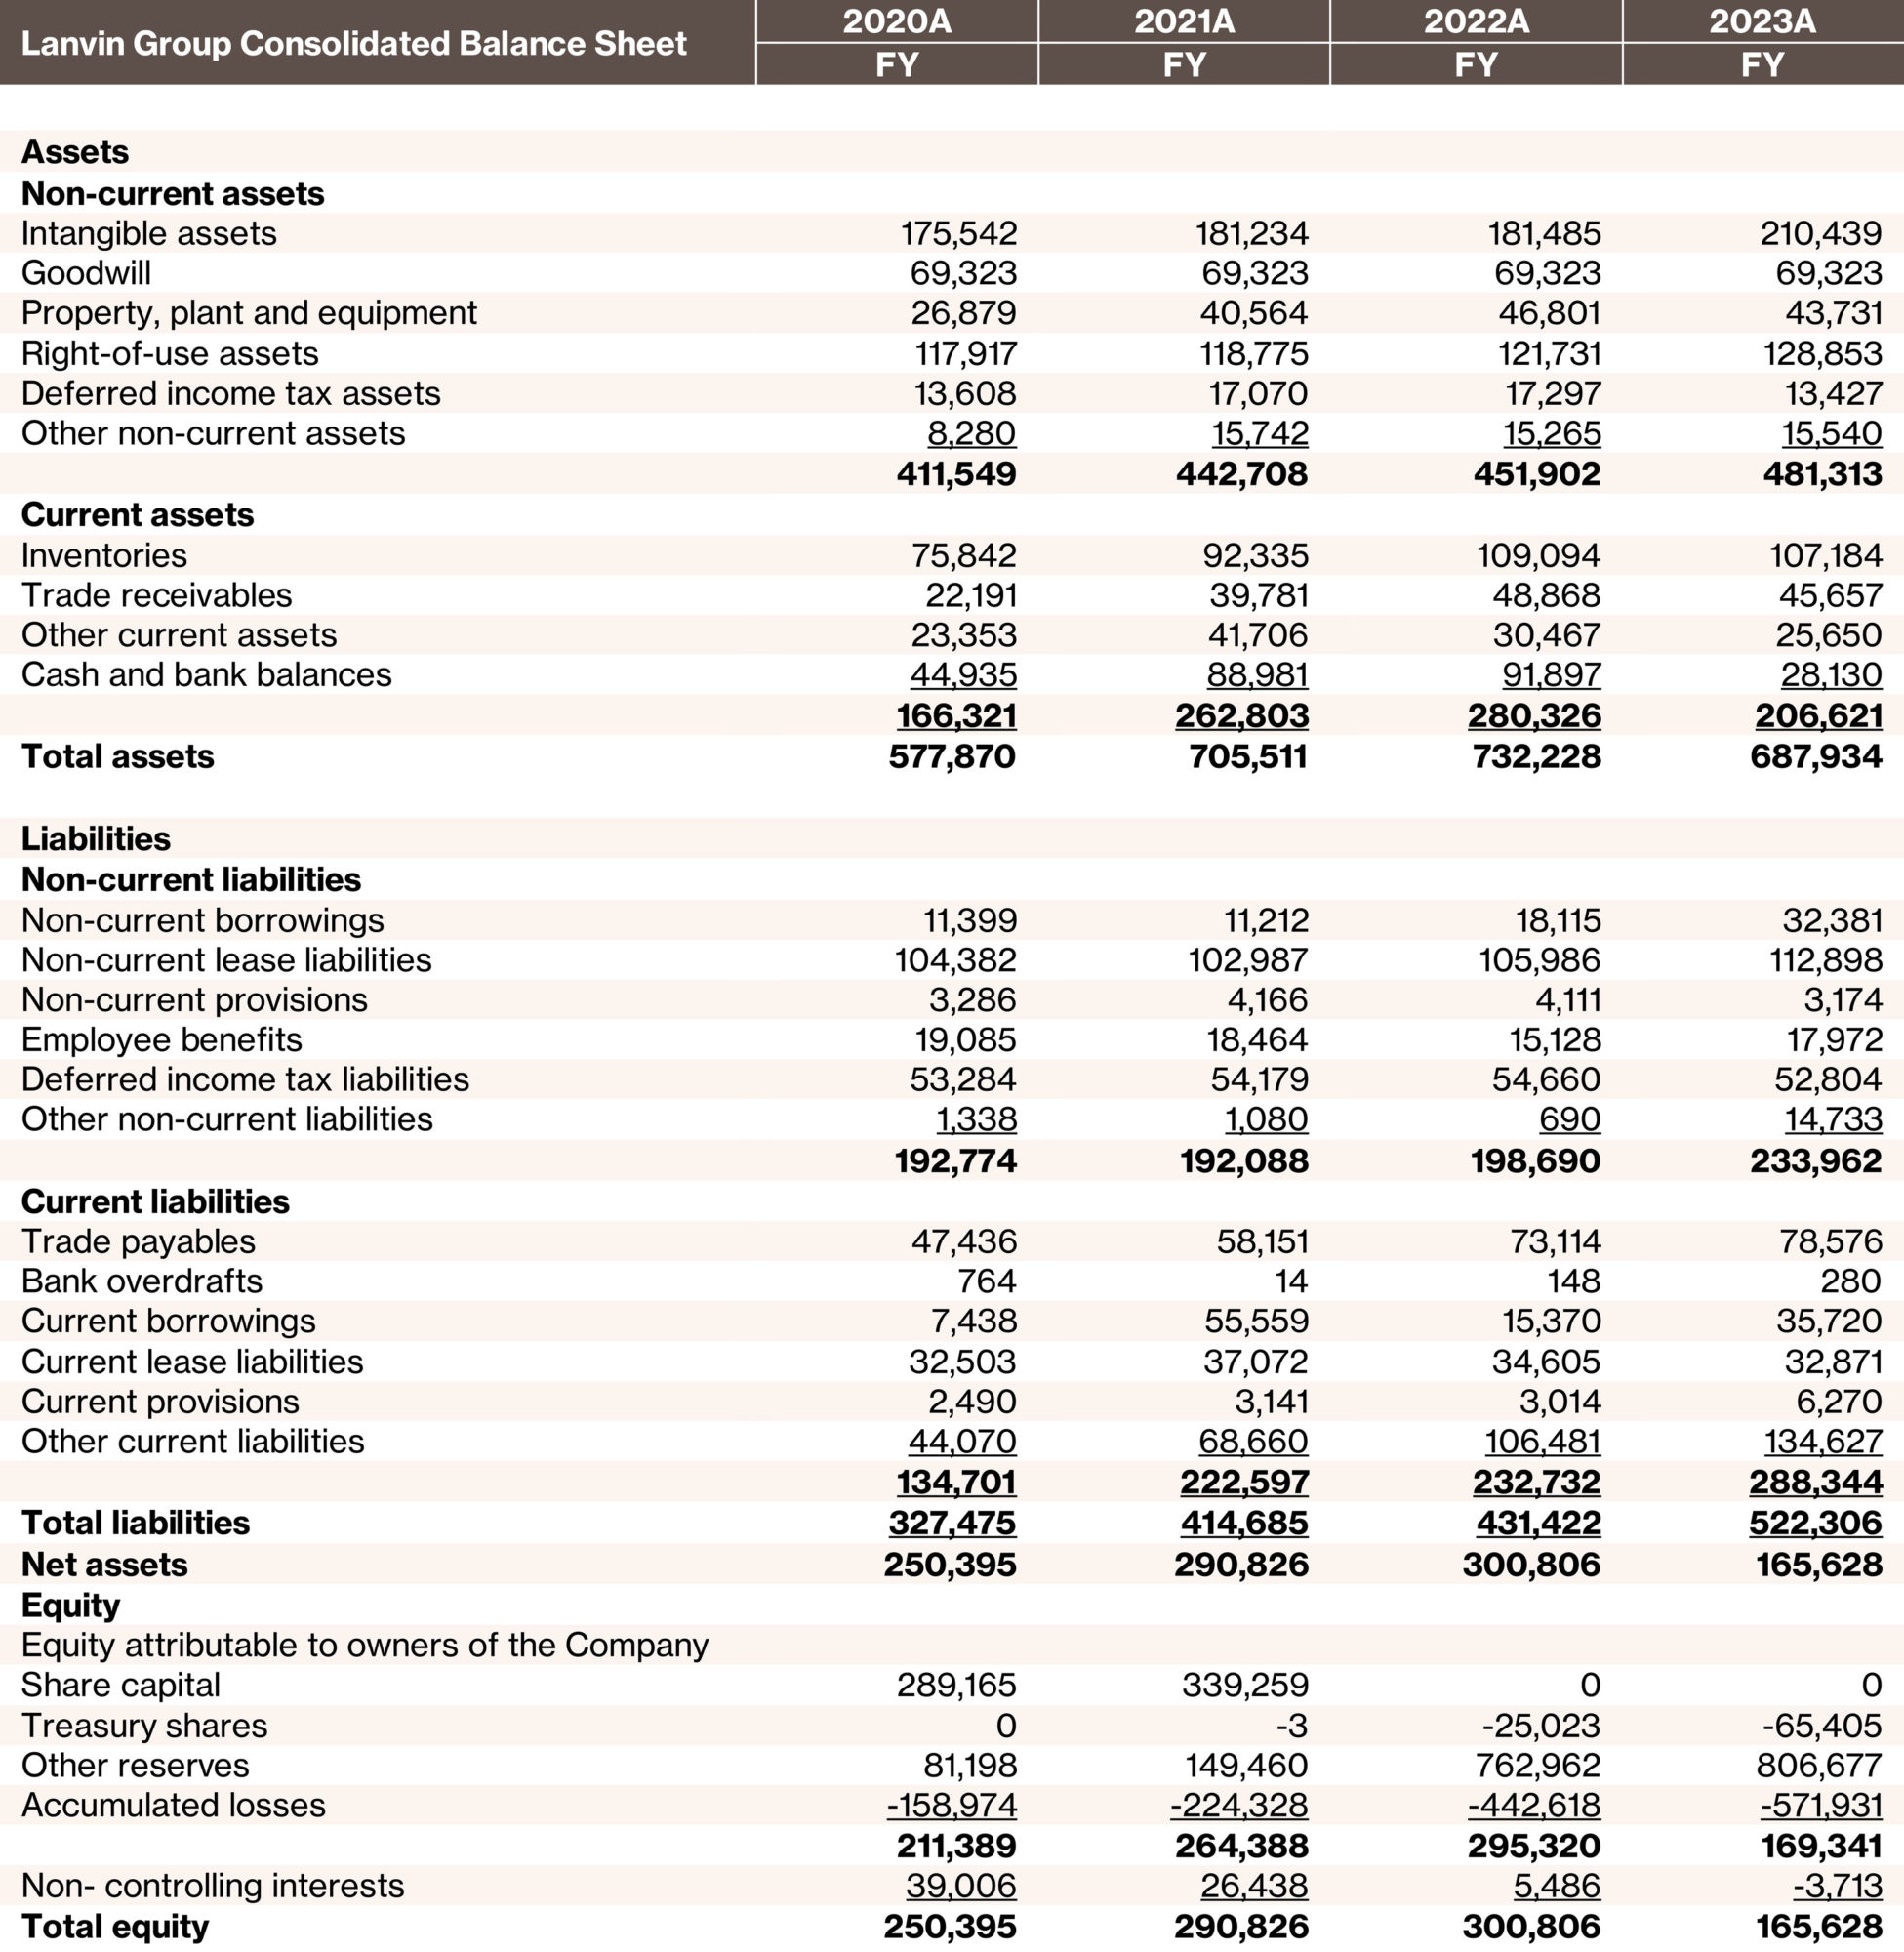
Lanvin Group Consolidated Balance Sheet
(€ in Thousands, unless otherwise noted)
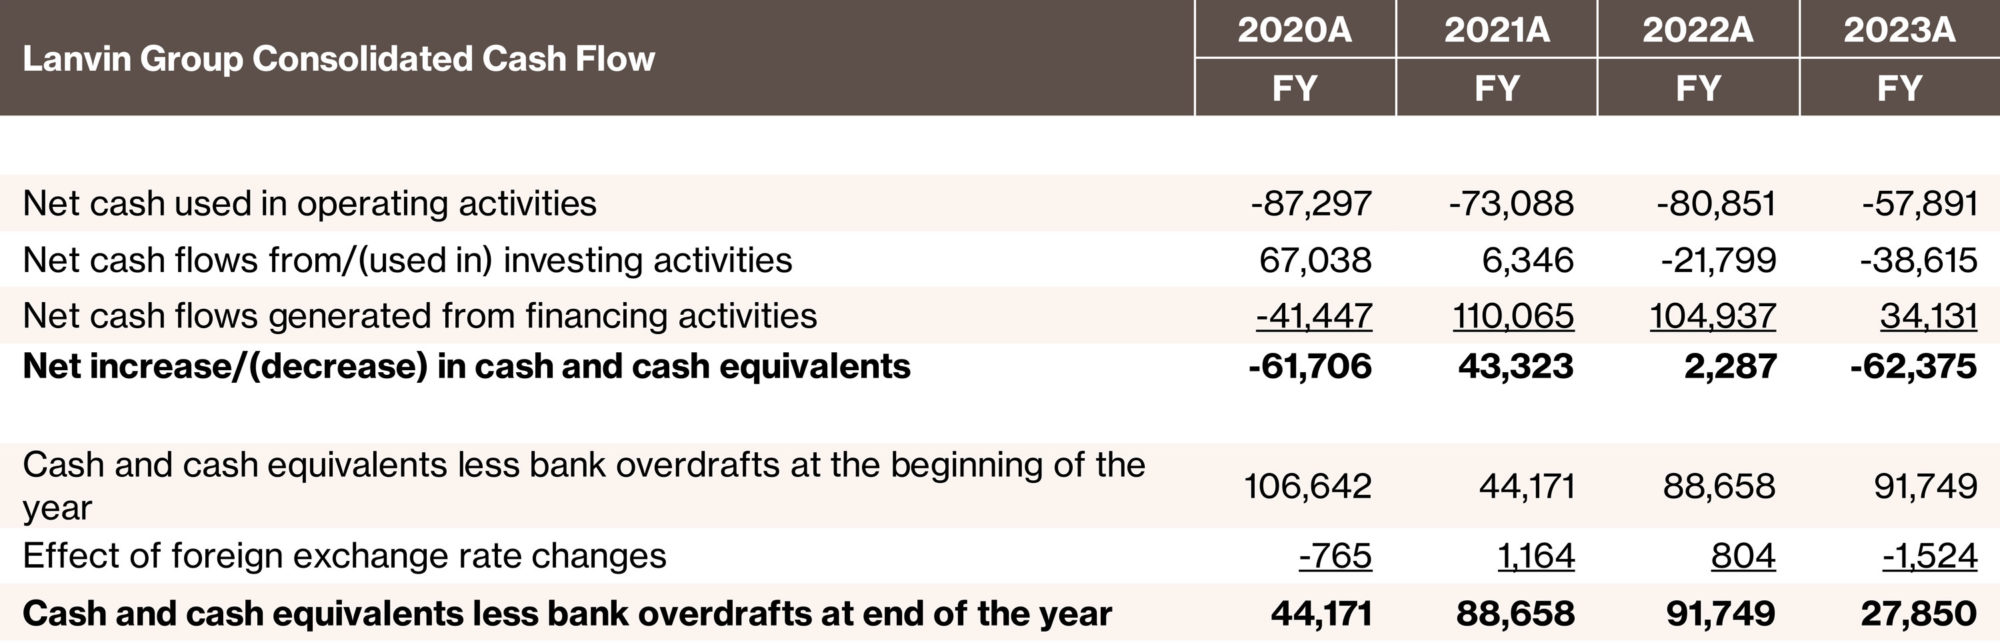
Lanvin Group Consolidated Cash Flow
(€ in Thousands, unless otherwise noted)
Lanvin Brand Key Financials (3)
(€ in Thousands, unless otherwise noted)
Wolford Brand Key Financials (3)
(€ in Thousands, unless otherwise noted)
Sergio Rossi Brand Key Financials (3)
(€ in Thousands, unless otherwise noted)
St. John Brand Key Financials (3)
(€ in Thousands, unless otherwise noted)
Caruso Brand Key Financials (3)
(€ in Thousands, unless otherwise noted)
Lanvin Group Brand Footprint
Non-IFRS Financial Measures Reconciliation
(€ in Thousands, unless otherwise noted)
(€ in Thousands, unless otherwise noted)
———————————-
Note:
(1) 2022 was impacted by a €84 million cost related to the Reverse Recapitalization that occurred as part of the SPAC merger; this cost is non-recurring in nature.
(2) These are Non-IFRS Financial Measures and will be mentioned throughout this communication. Please see Non-IFRS Financial Measures and Definition.
(3) Brand-level results are presented exclusive of eliminations.
(4) DOS refers to Directly Operated Stores which include boutiques, outlets, concession shop-in-shops and pop-up stores.
(5) POS refers to Point of Sales which include DOS and wholesale accounts.
Non-IFRS Financial Measures and Definition
Our management monitors and evaluates operating and financial performance using several non-IFRS financial measures including: contribution profit, contribution margin, Adjusted EBIT and Adjusted EBITDA. Our management believes that these non-IFRS financial measures provide useful and relevant information regarding our performance and improve their ability to assess financial performance and financial position. They also provide comparable measures that facilitate management’s ability to identify operational trends, as well as make decisions regarding future spending, resource allocations and other operational decisions. While similar measures are widely used in the industry in which we operate, the financial measures that we use may not be comparable to other similarly named measures used by other companies nor are they intended to be substitutes for measures of financial performance or financial position as prepared in accordance with IFRS.
Contribution profit is defined as revenue less the cost of sales and selling and marketing expenses. Contribution profit subtracts the main variable expenses of selling and marketing expenses from gross profit, and our management believes this measure is an important indicator of profitability at the marginal level. Below contribution profit, the main expenses are general administrative expenses and other operating expenses (which include foreign exchange gains or losses and impairment losses). As we continue to improve the management of our portfolio brands, we believe we can achieve greater economy of scale across the different brands by maintaining the fixed expenses at a lower level as a proportion of revenue. We therefore use contribution profit margin as a key indicator of profitability at the group level as well as the portfolio brand level.
Contribution margin is defined as contribution profit divided by revenue.
Adjusted EBIT is defined as profit or loss before income taxes, net finance cost, share based compensation, adjusted for income and costs which are significant in nature and that management considers not reflective of underlying operational activities, mainly including net gains on disposal of long-term assets, negative goodwill from acquisition of Sergio Rossi, gain on debt restructuring and government grants.
Adjusted EBITDA is defined as profit or loss before income taxes, net finance cost, exchange gains/(losses), depreciation, amortization, share based compensation and provisions and impairment losses adjusted for income and costs which are significant in nature and that management considers not reflective of underlying operational activities, mainly including net gains on disposal of long-term assets, negative goodwill from acquisition of Sergio Rossi, gain on debt restructuring and government grants.